
Kronos — User Guide
A practical, plain-language manual for people who use Kronos, not people who build it. Kronos is an interactive viewer for phylogenetic trees shown side-by-side with sample metadata. You load a tree, load a table of metadata about your samples, and then explore the relationships between them — colouring tips by country or resistance, searching for a strain, collapsing a clade, re-rooting, and (in Tableau) linking your selections to the rest of a dashboard.
This guide covers the hosted/standalone viewer and the Tableau extension. You do not need to know anything about Newick formats, WebGL, or command lines to follow it — but where a detail matters, it is explained.
In a hurry? Jump to Quick start and Loading your data. The single most important rule is in The golden rule: IDs must match exactly.
Table of contents
- What Kronos is, and the two ways to use it
- Quick start (60 seconds)
- The interface at a glance
- The two renderers (Phylocanvas.gl vs SVG)
- Loading your data
- Navigating the tree
- Searching
- The metadata table
- Colouring tips by metadata
- Customising appearance (the gear panel)
- Reshaping and annotating the tree (right-click menu)
- Saving and exporting your work
- Using Kronos inside Tableau
- Troubleshooting
- Keyboard and mouse reference
- Privacy and data handling
- Glossary
- Getting help
1. What Kronos is, and the two ways to use it
Kronos visualises a phylogenetic tree — a branching diagram of how your samples relate to one another — and overlays metadata (country, species, collection year, resistance profile, or any columns you supply). It is built for public-health and genomic-epidemiology work, where you often need to see “which samples cluster together, and what do they have in common?”
There are two ways people use Kronos:
| Way | What it is | Best for |
|---|---|---|
| Standalone viewer | A self-contained web page. Hosted at https://kronos.theiagen.app/, or run locally. You upload a tree and metadata directly. |
Quick exploration, ad-hoc analysis, sharing a single tree. |
| Tableau extension | Kronos embedded as a panel inside a Tableau dashboard. The tree is linked to your Tableau worksheets so selections flow both ways. | Dashboards where the tree is one view among many, and selecting a sample should filter the rest of the dashboard. |
Most of this guide applies to both. The Tableau-specific setup (adding the extension, the configuration dialog, selection sync) is gathered in Section 13.
2. Quick start (60 seconds)
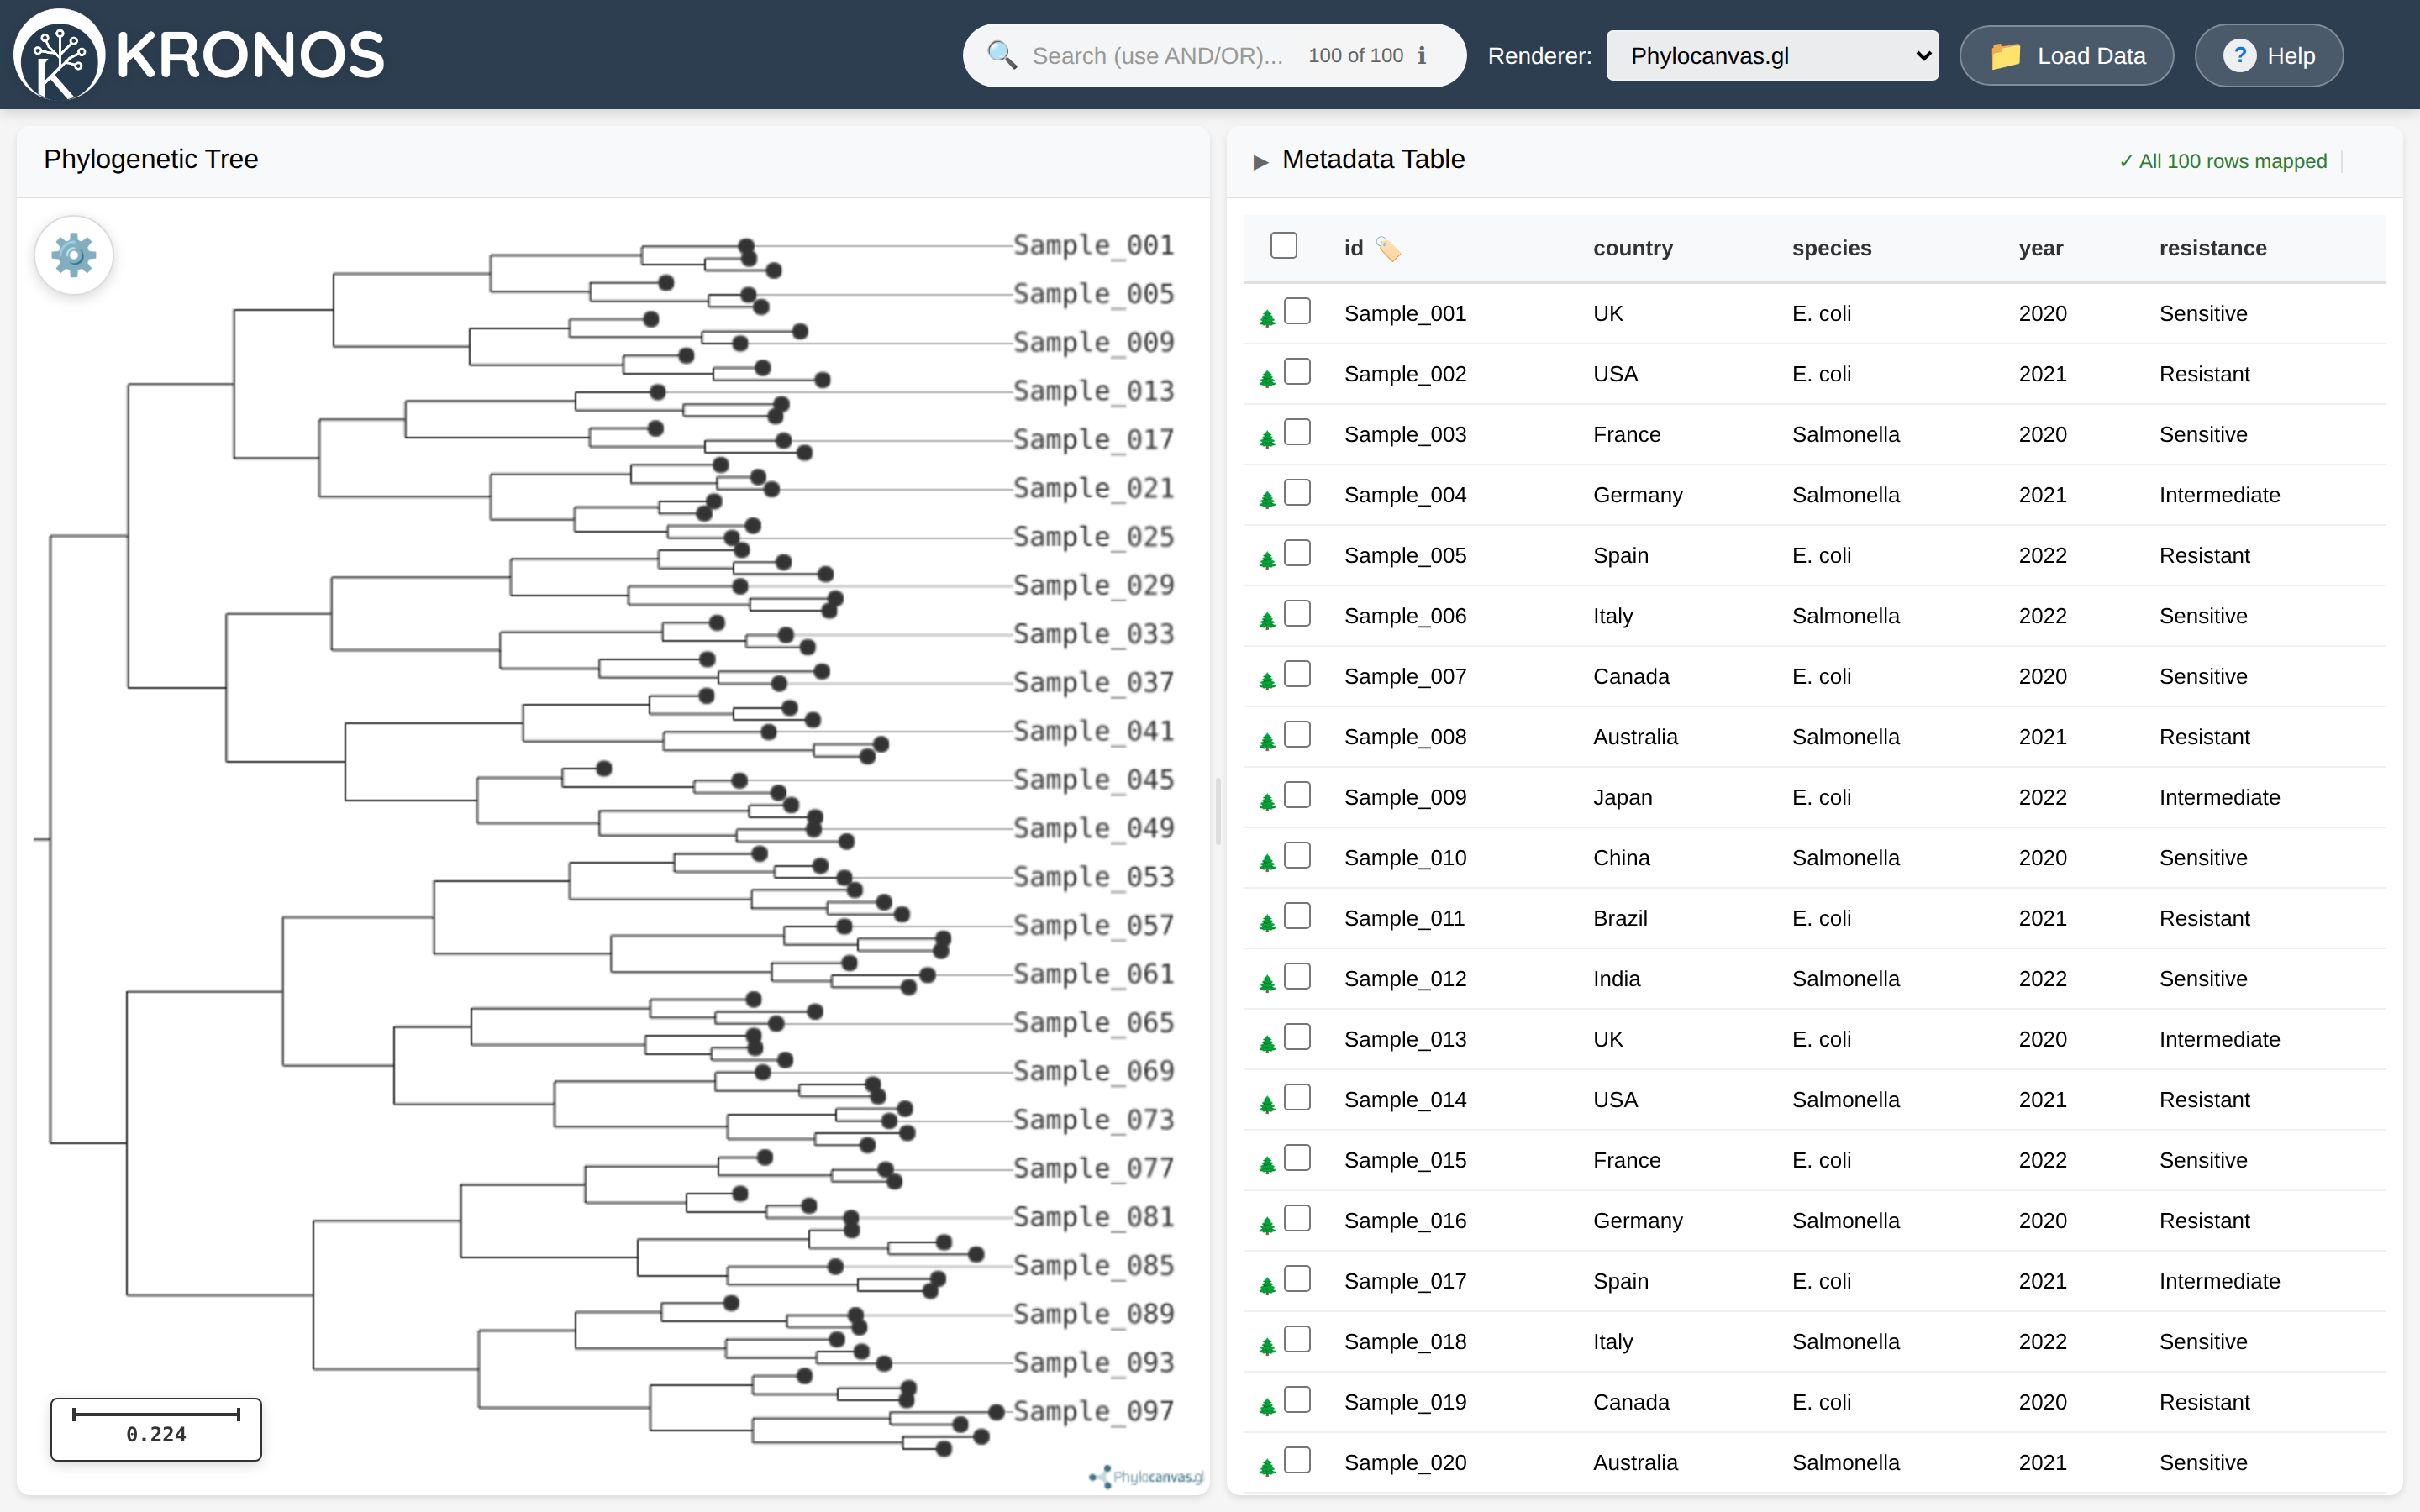
Figure 1. Kronos on first load — a demo tree and its metadata are already in place, so you can explore immediately.
Using the standalone viewer:
- Open Kronos. It loads with a demo tree and demo metadata already in place, so you have something to play with immediately.
- Hover and click. Click a row in the metadata table — the matching tip in the tree is highlighted and centred. Click a column header to sort.
- Search. Type a sample name or a metadata value (for example a country) into the search box at the top. Matches are counted as you type.
- Colour the tree. Open the renderer’s controls (the ⚙ gear button at the top-right of the tree, or Phylocanvas.gl’s own menu) and pick a field under Colour by to recolour the tips.
- Load your own data. Click Load Data in the header, drop in your Newick tree (and optionally a metadata CSV), and click Load Data again. Your files never leave your computer.
That is the whole loop: load → look → colour → search → select. The rest of this guide explains each part in depth.
3. The interface at a glance
The standalone viewer has three regions.
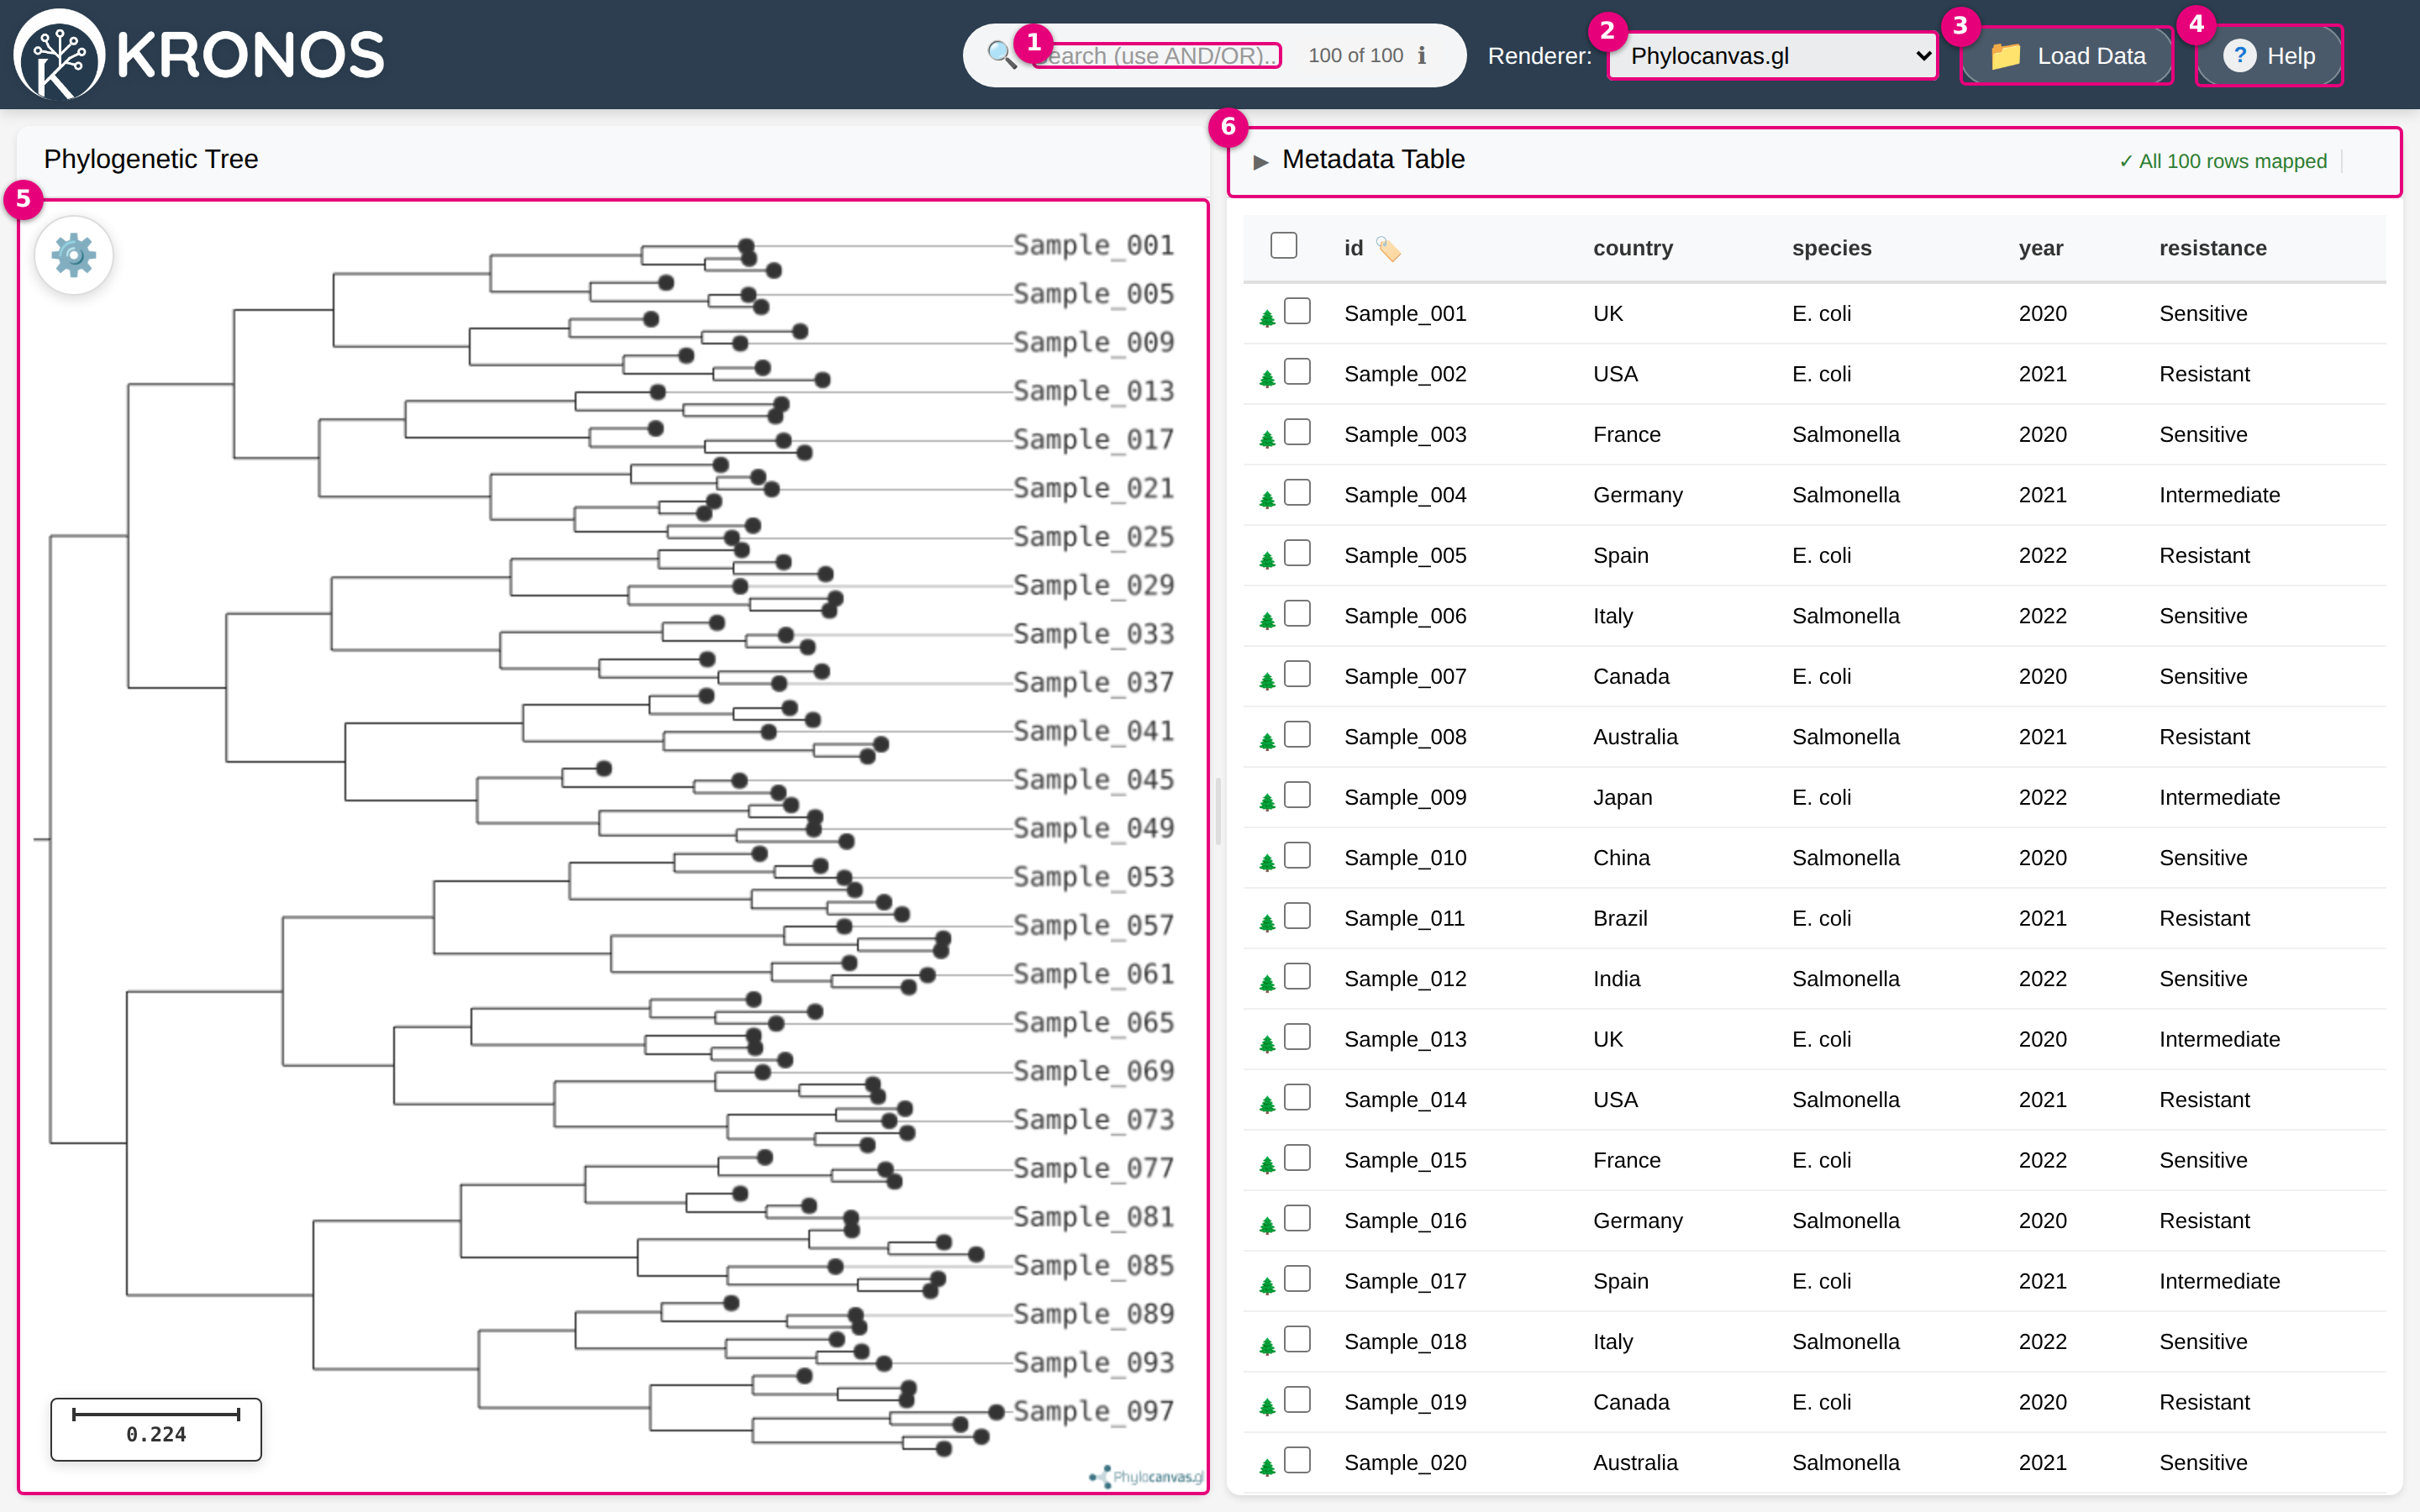
Figure 2. The interface at a glance. ① Search box · ② Renderer dropdown · ③ Load Data · ④ Help · ⑤ Tree panel · ⑥ Metadata table.
The header (top bar)
From left to right:
- Kronos logo.
- Search box —
Search (use AND/OR).... Finds tips and metadata rows. A results counter (for example5 of 42) and a small ℹ button (search help) sit beside it, with an × to clear. - Renderer: dropdown — choose Phylocanvas.gl or TheiaPhyloViewer (SVG). See Section 4.
- Load Data (📁) — opens the upload dialog. See Section 5.
- Help (?) — opens a built-in quick reference.
The tree panel (left/main)
The phylogenetic tree itself. Depending on the renderer you will also see:
- A ⚙ gear button at the top-right (SVG renderer) that opens the Appearance panel.
- A Clear / Clear Selection button when one or more tips are selected.
- A scale bar showing branch-length distance (if enabled).
You pan by dragging and zoom with the mouse wheel. Right-click anywhere for the context menu (Section 11).
The metadata table (right/bottom)
A sortable, selectable table of your samples. Its header is collapsible (click the title to fold it away and give the tree more room). A resize handle between the tree and the table lets you change how the space is split. The table header also shows mapping info (how many rows are matched to tips) and selection info (how many rows are selected). See Section 8.
4. The two renderers
Kronos can draw the tree with either of two engines. Pick one from the Renderer: dropdown; your choice is remembered the next time you open Kronos.
| Phylocanvas.gl | TheiaPhyloViewer (SVG) | |
|---|---|---|
| Technology | WebGL (GPU-accelerated) | Plain SVG (no GPU needed) |
| Strengths | Very fast on large trees; lasso selection; PNG export | Works everywhere (including Tableau Desktop); rich appearance panel; clade/label annotations; session save/load |
| Settings live in | Its own built-in menu | The ⚙ Appearance panel |
| Needs WebGL? | Yes | No |
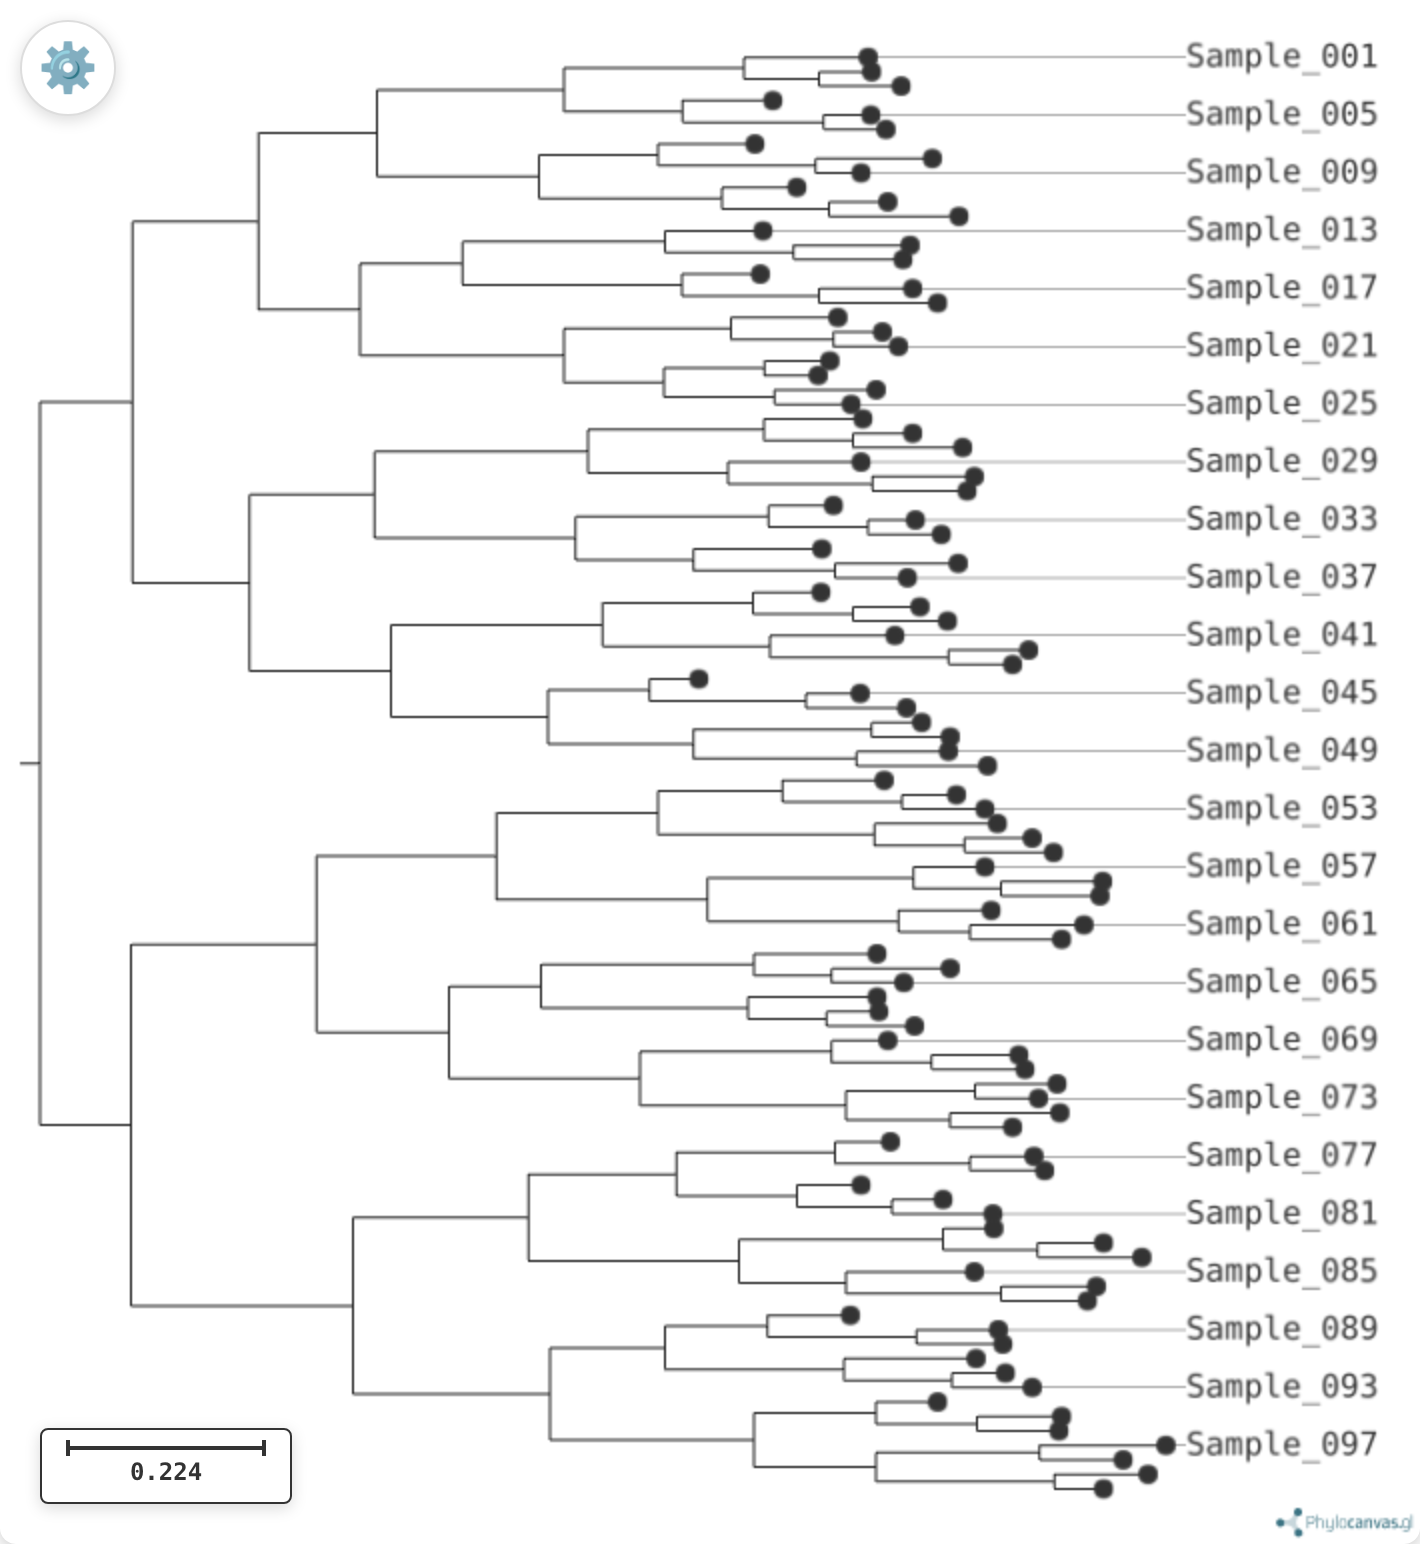
Figure 3a. The Phylocanvas.gl (WebGL) renderer, with its own embedded controls.
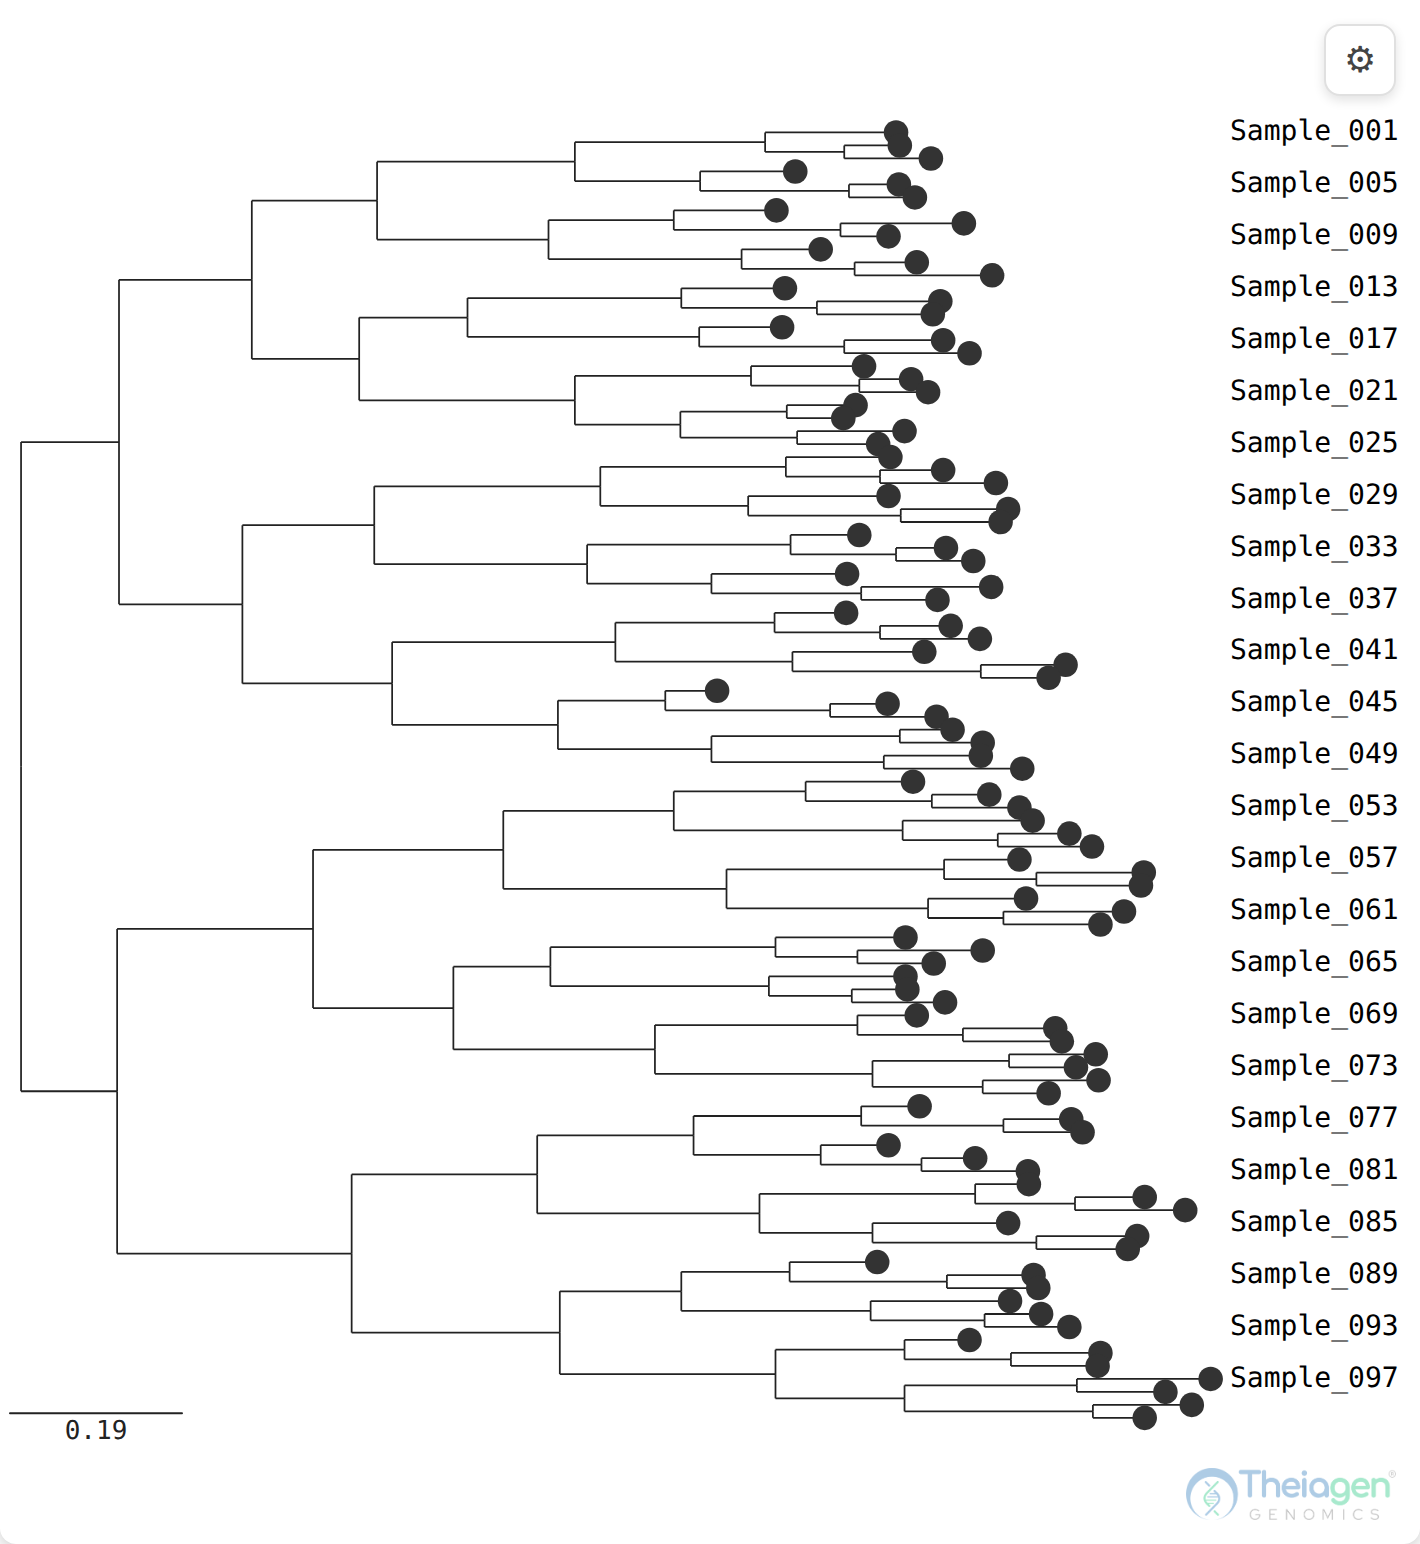
Figure 3b. The TheiaPhyloViewer (SVG) renderer, configured from the ⚙ Appearance panel.
Which one is selected by default? Kronos picks for you based on your environment. If your browser supports WebGL, it defaults to Phylocanvas.gl. If WebGL is unavailable — most notably inside Tableau Desktop, whose embedded browser does not support WebGL reliably — it defaults to the SVG renderer so you always get a tree. You can override the choice at any time with the dropdown.
If the tree is blank, you are almost certainly on a WebGL-less environment with Phylocanvas.gl selected. Switch the Renderer to TheiaPhyloViewer (SVG). See Troubleshooting.
Switching renderers redraws the tree but carries your work across: it keeps your selected rows highlighted and re-applies your appearance settings — colour-by, tip colours, layout, node and label sizes, and metadata blocks — so only the drawing engine changes, not your view. The ⚙ Appearance panel appears only for the SVG renderer; Phylocanvas.gl shows its own menu instead.
5. Loading your data
Kronos needs one tree and, optionally, one metadata table.
What a tree file looks like (Newick)
A tree is a Newick file — a compact text format that nests samples in parentheses with branch
lengths after colons. Accepted extensions: .nwk, .newick, .tree. A tiny example:
((Sample_001:0.10,Sample_002:0.15):0.20,(Sample_003:0.12,Sample_004:0.08):0.18):0.0;
The names at the tips (Sample_001, Sample_002, …) are the leaf labels. These are what
Kronos matches your metadata against.
What a metadata file looks like (CSV/TSV)
Metadata is a table — CSV, TSV, or plain text. Accepted extensions: .csv, .tsv,
.txt. It needs one column whose values exactly equal the tree’s leaf labels (often called
id, sample_id, or strain), plus any other columns you like:
id,country,species,year,resistance
Sample_001,UK,E. coli,2021,Sensitive
Sample_002,USA,E. coli,2022,Resistant
Sample_003,UK,K. pneumoniae,2021,Resistant
Sample_004,France,E. coli,2023,Sensitive
The golden rule: IDs must match exactly
The metadata’s ID column must match the tree’s leaf labels byte-for-byte.
This is the single most common source of “nothing is colouring” or “selecting a row doesn’t highlight anything.” A match fails silently when there is:
- Trailing or leading whitespace (
Sample_001vsSample_001). - A case difference (
sample_001vsSample_001). - Surrounding quotes or invisible characters introduced by a spreadsheet export.
- Punctuation drift — spaces vs underscores vs dots (
Sample 001vsSample_001).
If matching is not working, line up one leaf label and one ID side by side and look for these.
How to load your files
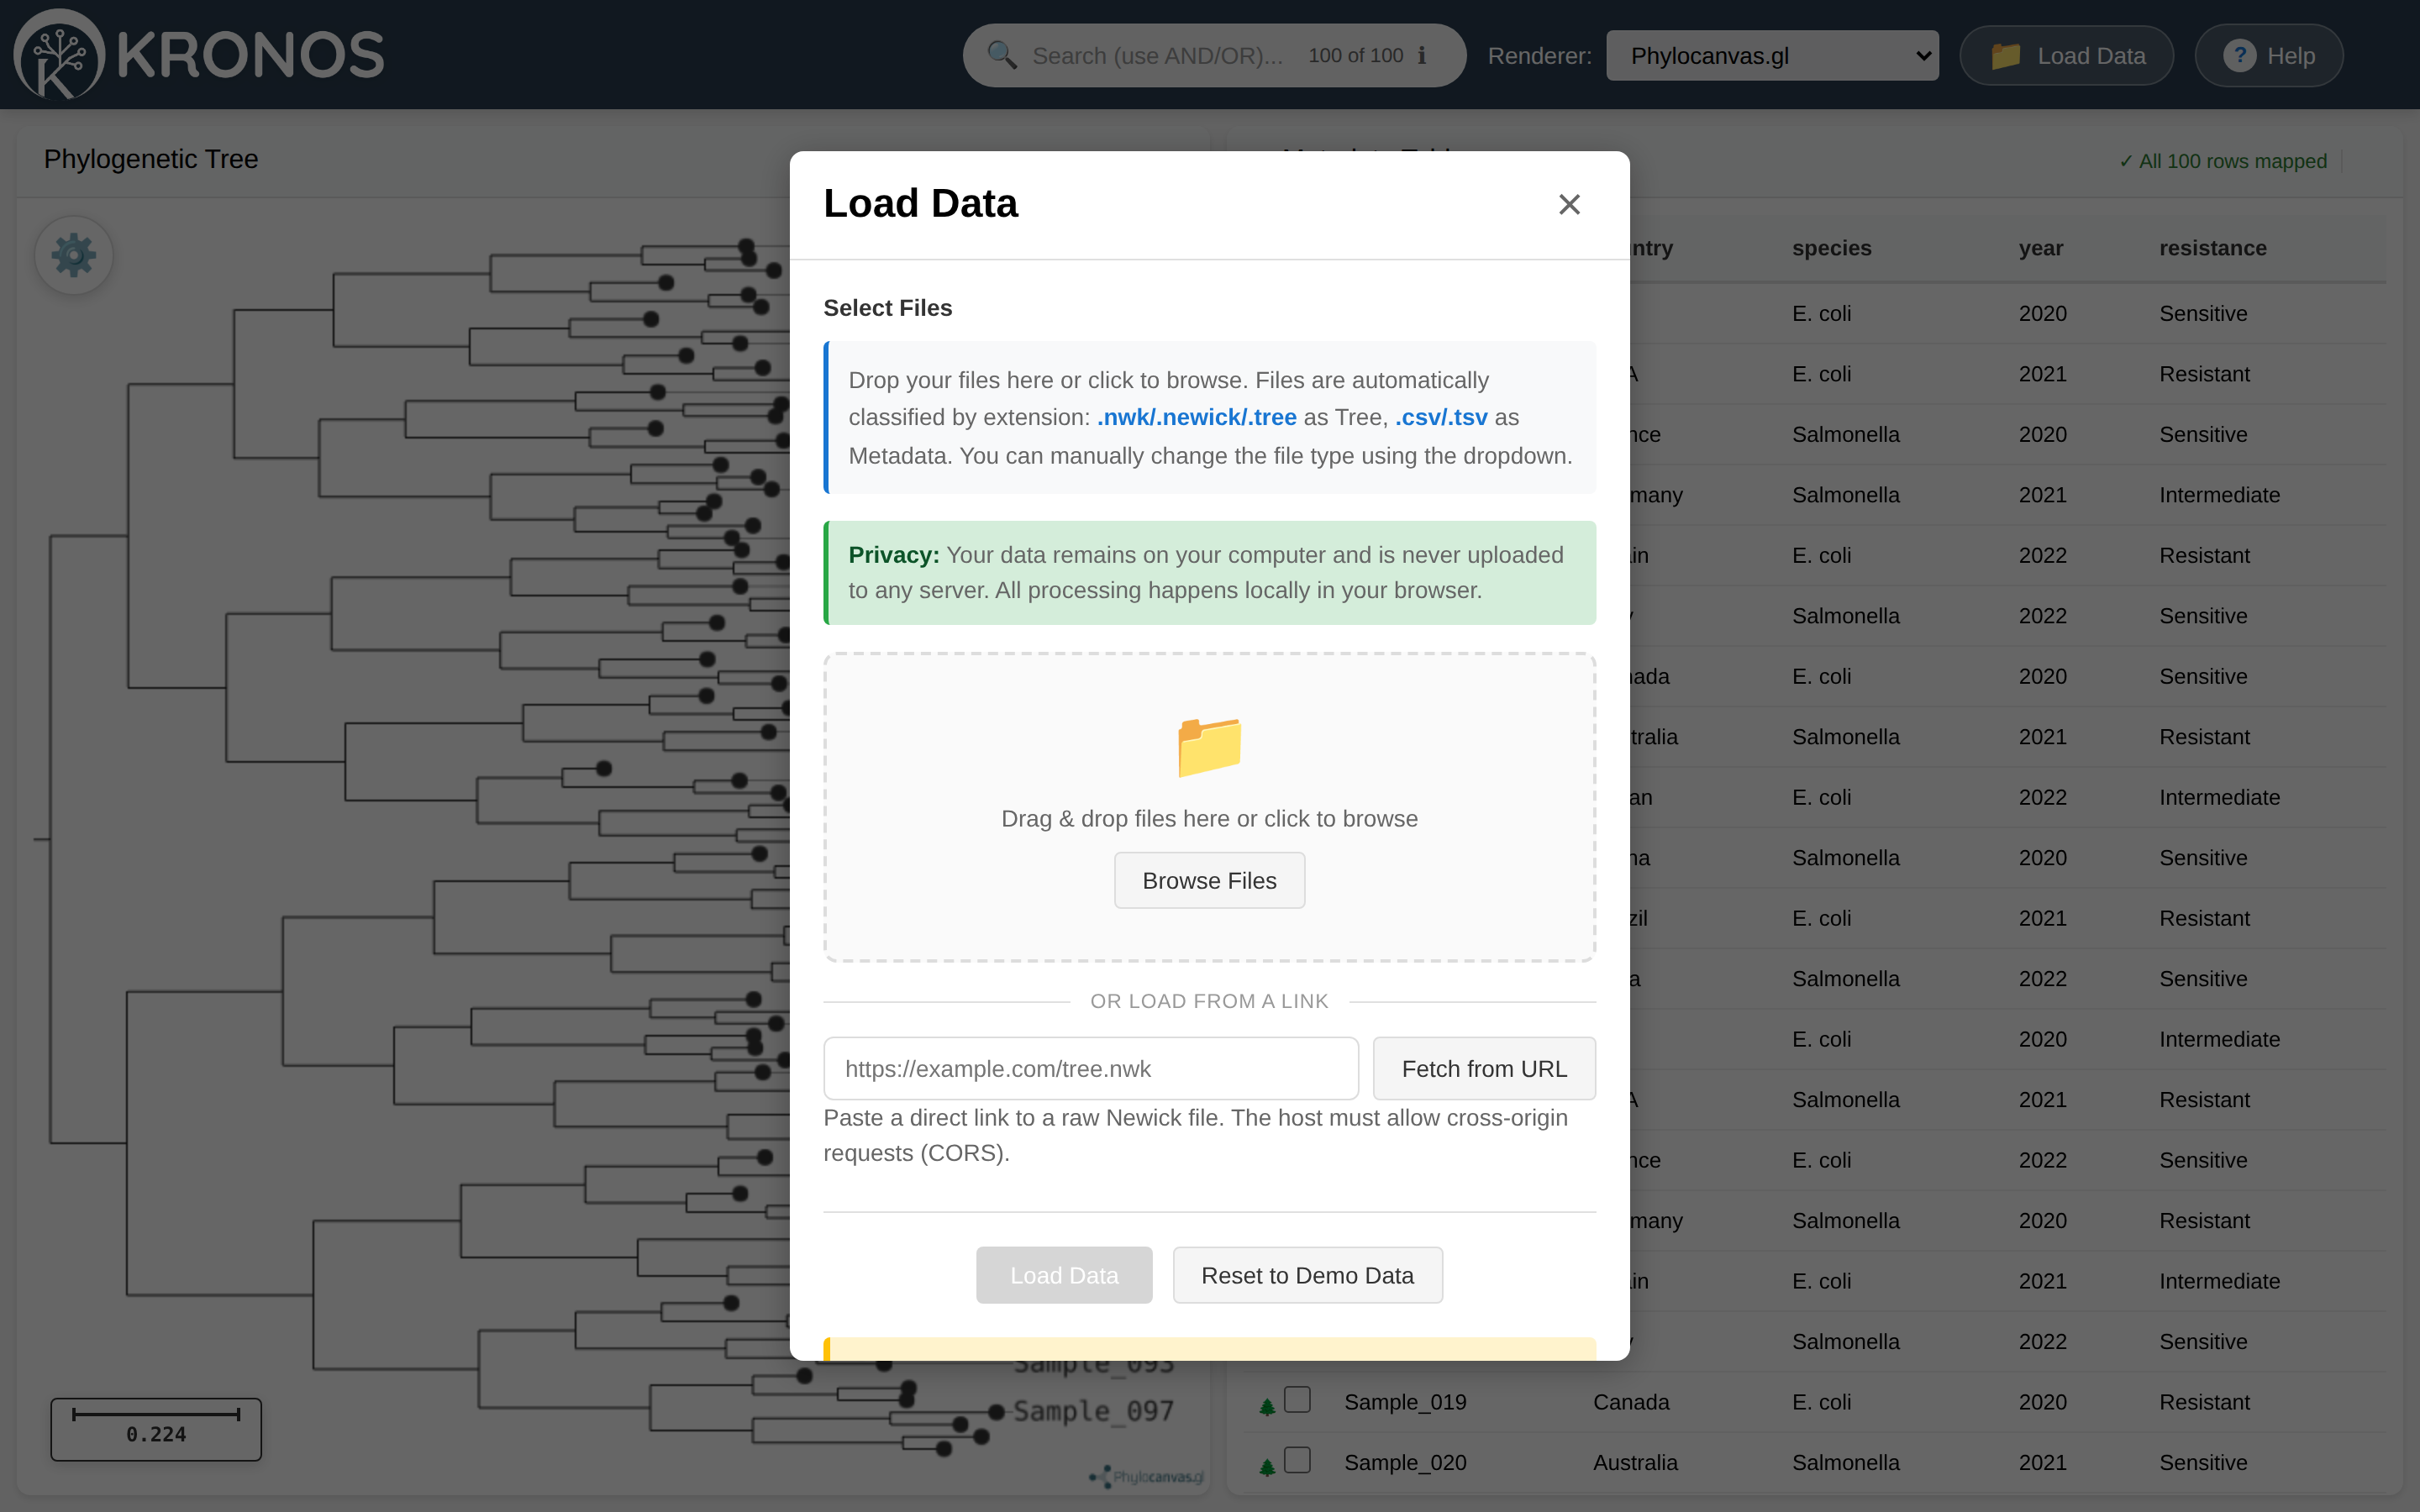
Figure 4. The Load Data dialog. Drop a Newick tree (and optional metadata table) onto the dropzone, browse, or paste a link to a raw Newick file. Your files never leave your computer.
- Click Load Data in the header.
- Drag and drop your files onto the dropzone, or click Browse Files.
- Kronos auto-classifies each file by its extension —
.nwk/.newick/.treeas Tree,.csv/.tsv/.txtas Metadata. If it guesses wrong, change a file’s type with its dropdown. - Click Load Data. (The button stays disabled until at least one tree file is present — metadata is optional.)
- To go back to the bundled example, click Reset to Demo Data.
A few things to expect:
- If you add more than one tree file, Kronos uses the first one and tells you so.
- If a file cannot be parsed, you get a clear message (for example “Failed to load data: …”). See RB: Newick rejected.
- You can load a tree only — the table simply shows “Tree-only mode (no metadata).”
Loading a tree from a link (URL)
If your tree already lives at a public web address, you can load it without downloading it first. Below the dropzone there’s an or load from a link field: paste a direct link to a raw Newick file and click Fetch from URL (or just press Enter).
A few pointers:
- The link must point at the raw file itself — the Newick text, not an HTML page that displays
it. Raw links from hosts like
raw.githubusercontent.com, a Gist’s Raw button, or a public storage bucket work well. Quick check: if opening the link in a new browser tab shows plain tree text (not a styled web page), it will load here. - The host must allow cross-origin (CORS) requests. Most raw-file hosts do; if one refuses, Kronos tells you so rather than failing silently.
- This loads a tree only — metadata still comes from a file here (or from your worksheet in Tableau), so the golden rule about matching IDs still applies.
- If anything goes wrong — a malformed link, an unreachable or CORS-blocking host, a request that times out, or a page that isn’t actually a Newick tree — you get a plain-language message and your current tree is left untouched. See RB: Fetch from URL.
In the standalone viewer a fetched tree lasts for the session, exactly like an upload. In the Tableau extension it is saved to the dashboard just like an upload, so it travels with the workbook.
6. Navigating the tree
| Action | How |
|---|---|
| Pan | Drag the tree with the mouse. |
| Zoom in/out | Mouse wheel over the tree. |
| Zoom to a specific tip | Select that sample — click its row in the metadata table (or its mark, in Tableau). Kronos centres the matching tip. With the SVG renderer it keeps your current zoom level and simply re-centres; Phylocanvas.gl zooms in on the node. |
| Fine zoom control (SVG) | Use the Branch zoom, Step zoom, and Zoom sliders in the ⚙ Appearance panel (Section 10). |
| Fit the whole tree (Phylocanvas.gl) | Right-click → Zoom to Fit. |
The Branch zoom and Step zoom sliders stretch the tree horizontally and vertically and are saved with your settings; the plain Zoom slider is a transient overall zoom relative to the current fit and is not saved. All of them work alongside the mouse wheel.
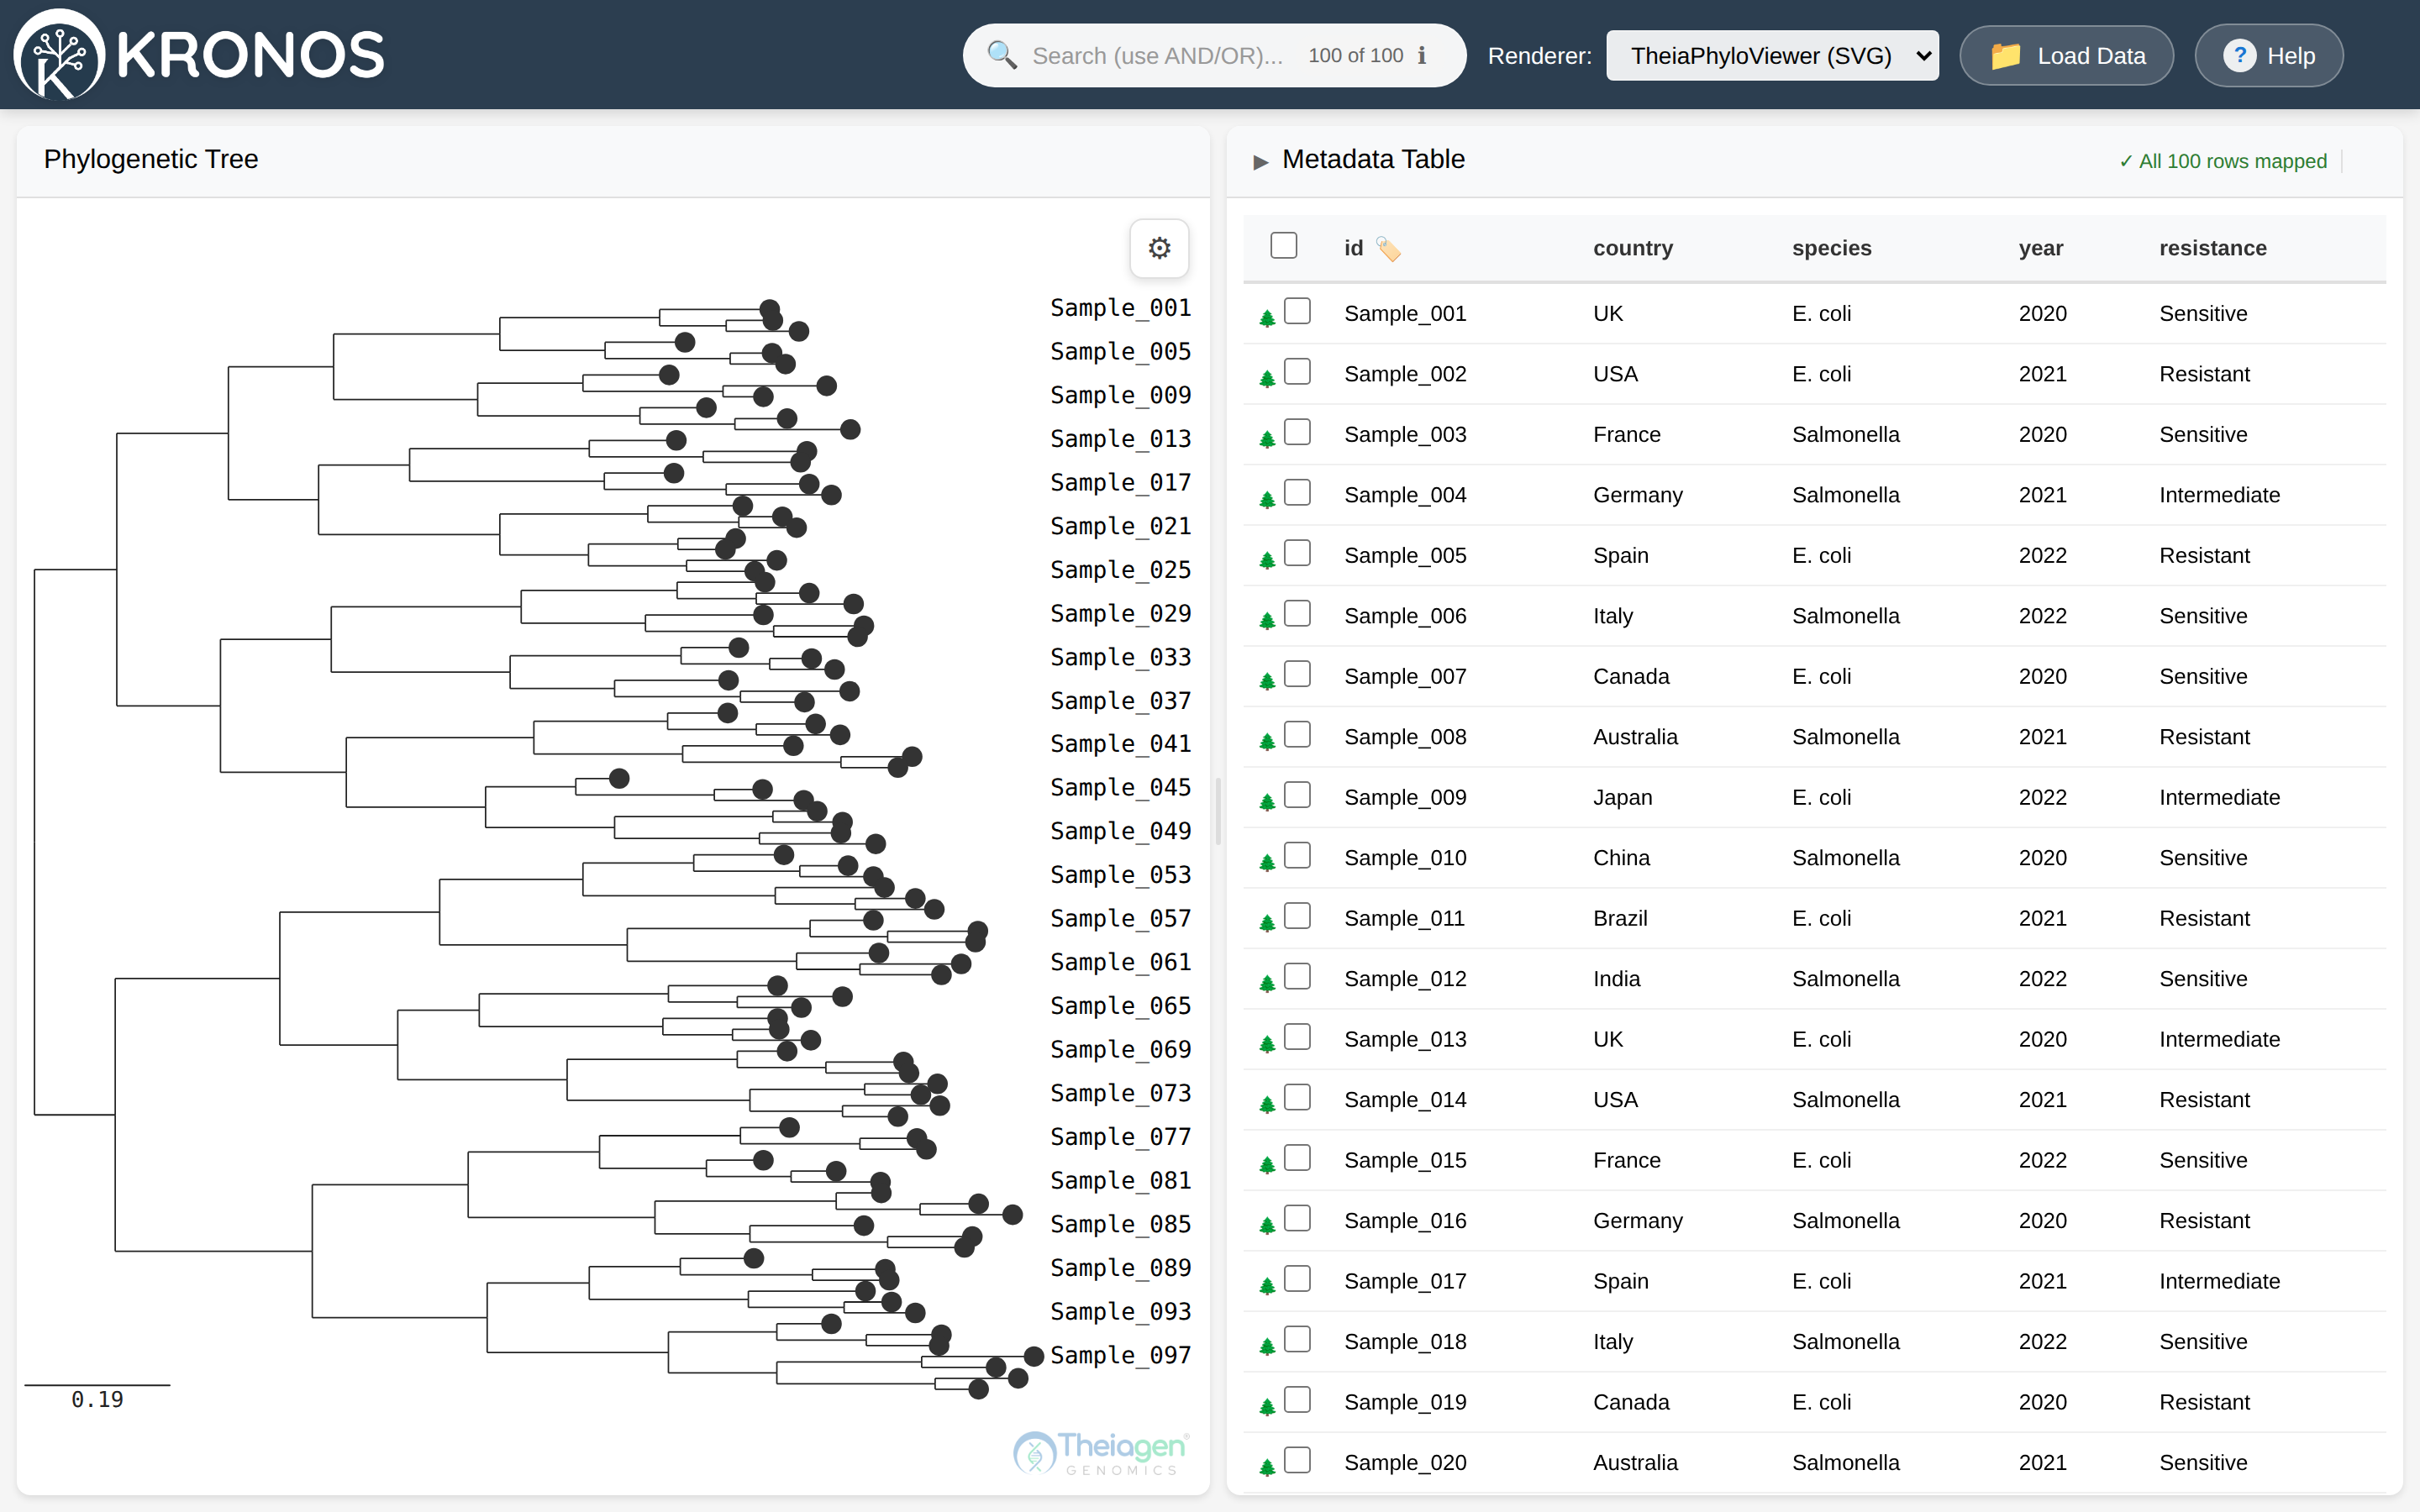
Figure 5. Zoomed out — the whole tree fits the canvas, so you can take in its overall shape at a glance.
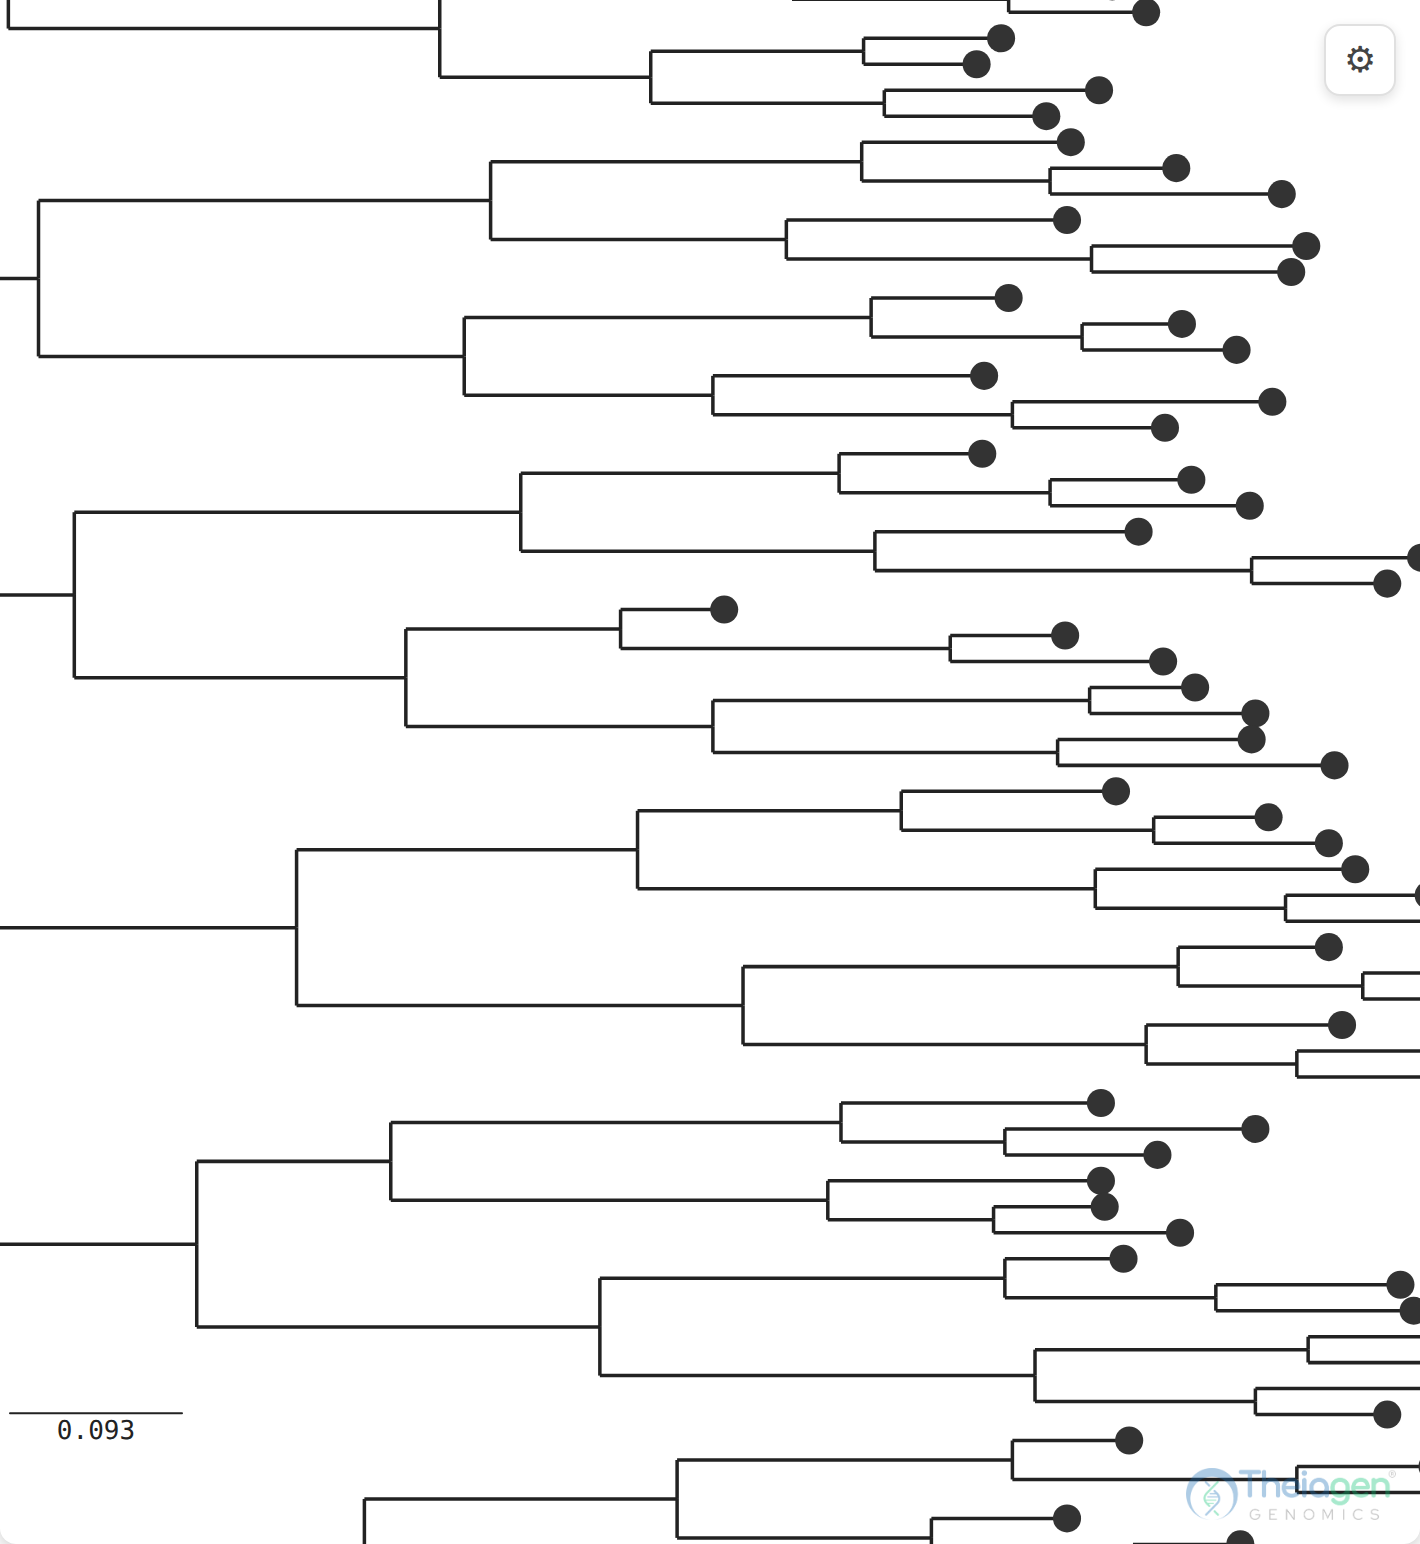
Figure 6. Zoomed in — wheel up (or raise the Zoom slider) to magnify a region; the tip markers grow with it and you pan to explore the rest. In this example the scale bar refines from 0.19 to 0.093 as the detail expands.
7. Searching
The search box finds matches across all metadata columns and all tip labels, case-insensitively.
- Basic: type any text —
Sample_001,UK,Resistant. - OR:
UK OR USAmatches rows containing either term. (A plain multi-word search behaves as OR.) - AND:
UK AND Resistantmatches rows containing both terms. - The counter shows
<matches> of <total>as you type. - The ℹ button opens a short explanation of these operators and the search scope.
- Press Esc, or click the ×, to clear the search.
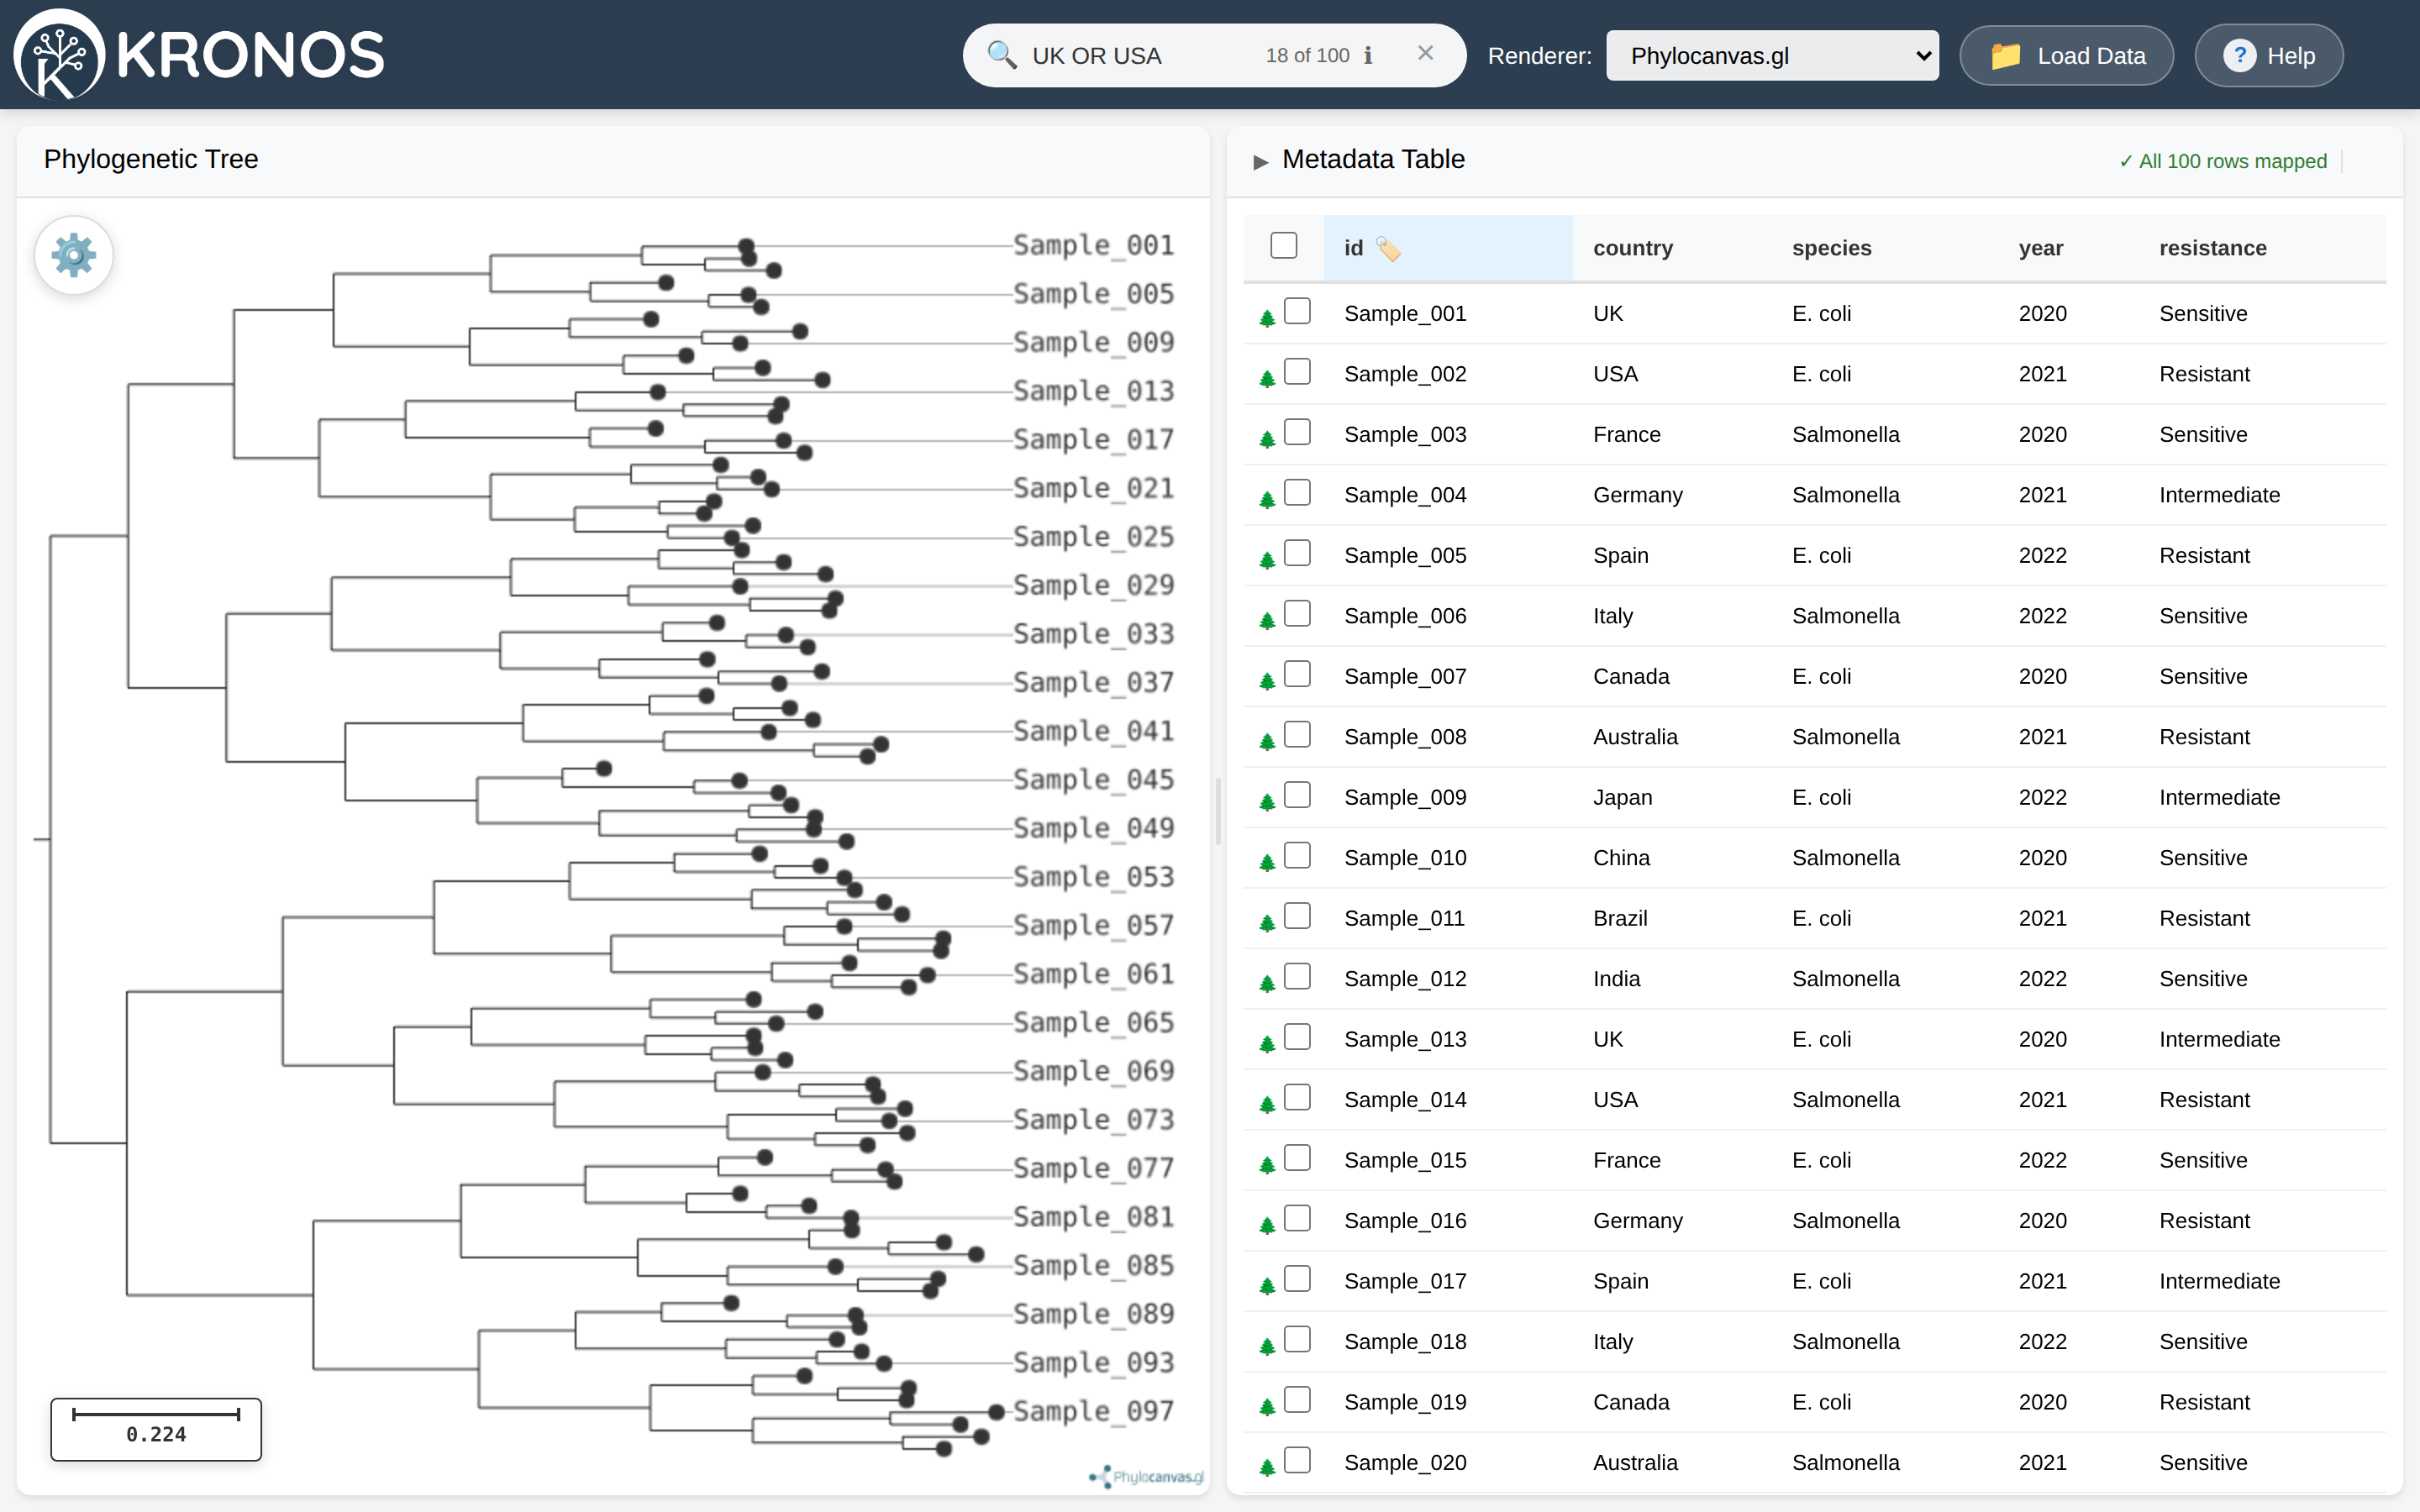
Figure 7. Searching UK OR USA highlights every matching tip and shows a live 18 of 100 match count.
8. The metadata table
Choosing the label field
The label field is the column Kronos uses to match table rows to tree tips. The active label field is marked with a 🏷 icon in its column header. To set it:
- Right-click the column header, or
- Shift-click the column header.
If you never set one, the Tableau configuration can auto-detect the best-matching column (Section 13); in the standalone viewer, set it explicitly when matching is not behaving.
Selecting rows
- Click a row to select it (and centre/highlight its tip in the tree).
- Ctrl-click (Windows/Linux) or Cmd-click (macOS) to select multiple rows; all selected tips are highlighted together.
- Click Clear (in the table header) or Clear Selection (on the tree) to deselect everything.
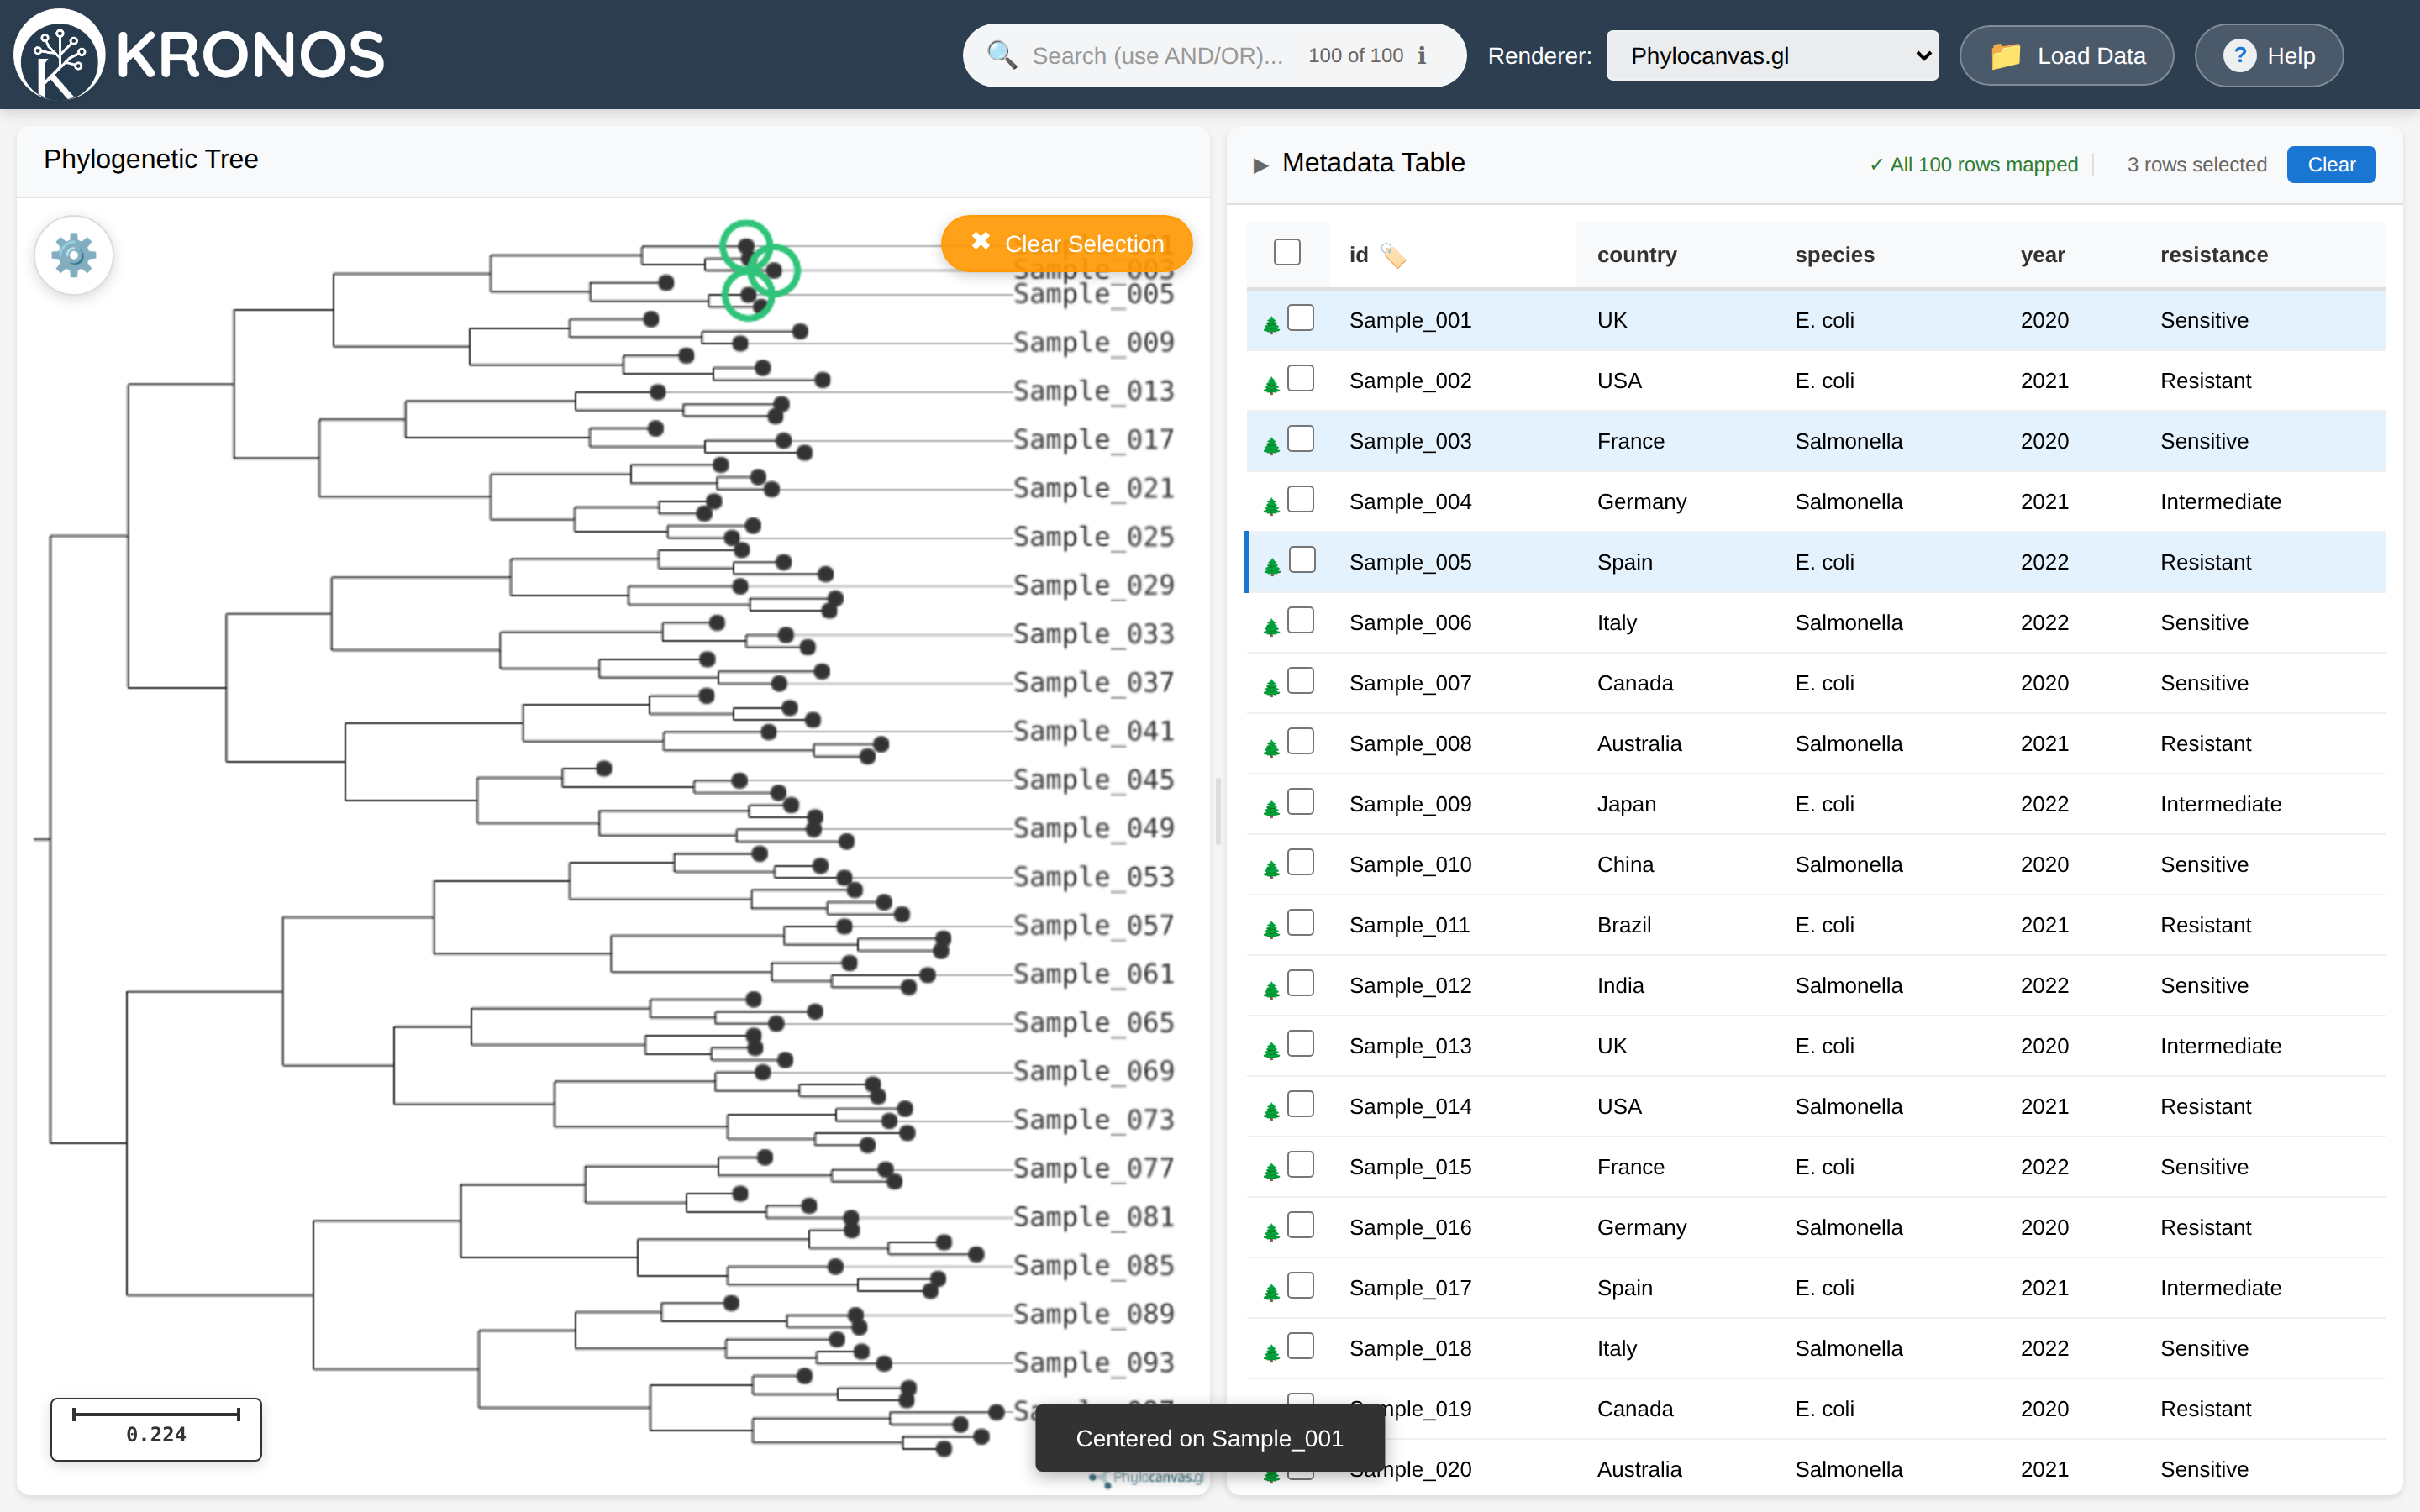
Figure 8. Selecting rows in the table highlights and centres the matching tips. A selection count and a Clear Selection button appear, and selection flows both ways.
Selecting tips on the tree (SVG renderer)
The TheiaPhyloViewer (SVG) renderer also lets you select tips directly on the tree — handy for grabbing a visual cluster without hunting for its rows. Start from the right-click menu:
- Lasso select — drag a freehand loop; every tip inside it is selected when you release.
- Box select — drag a rectangle; every tip inside it is selected when you release.
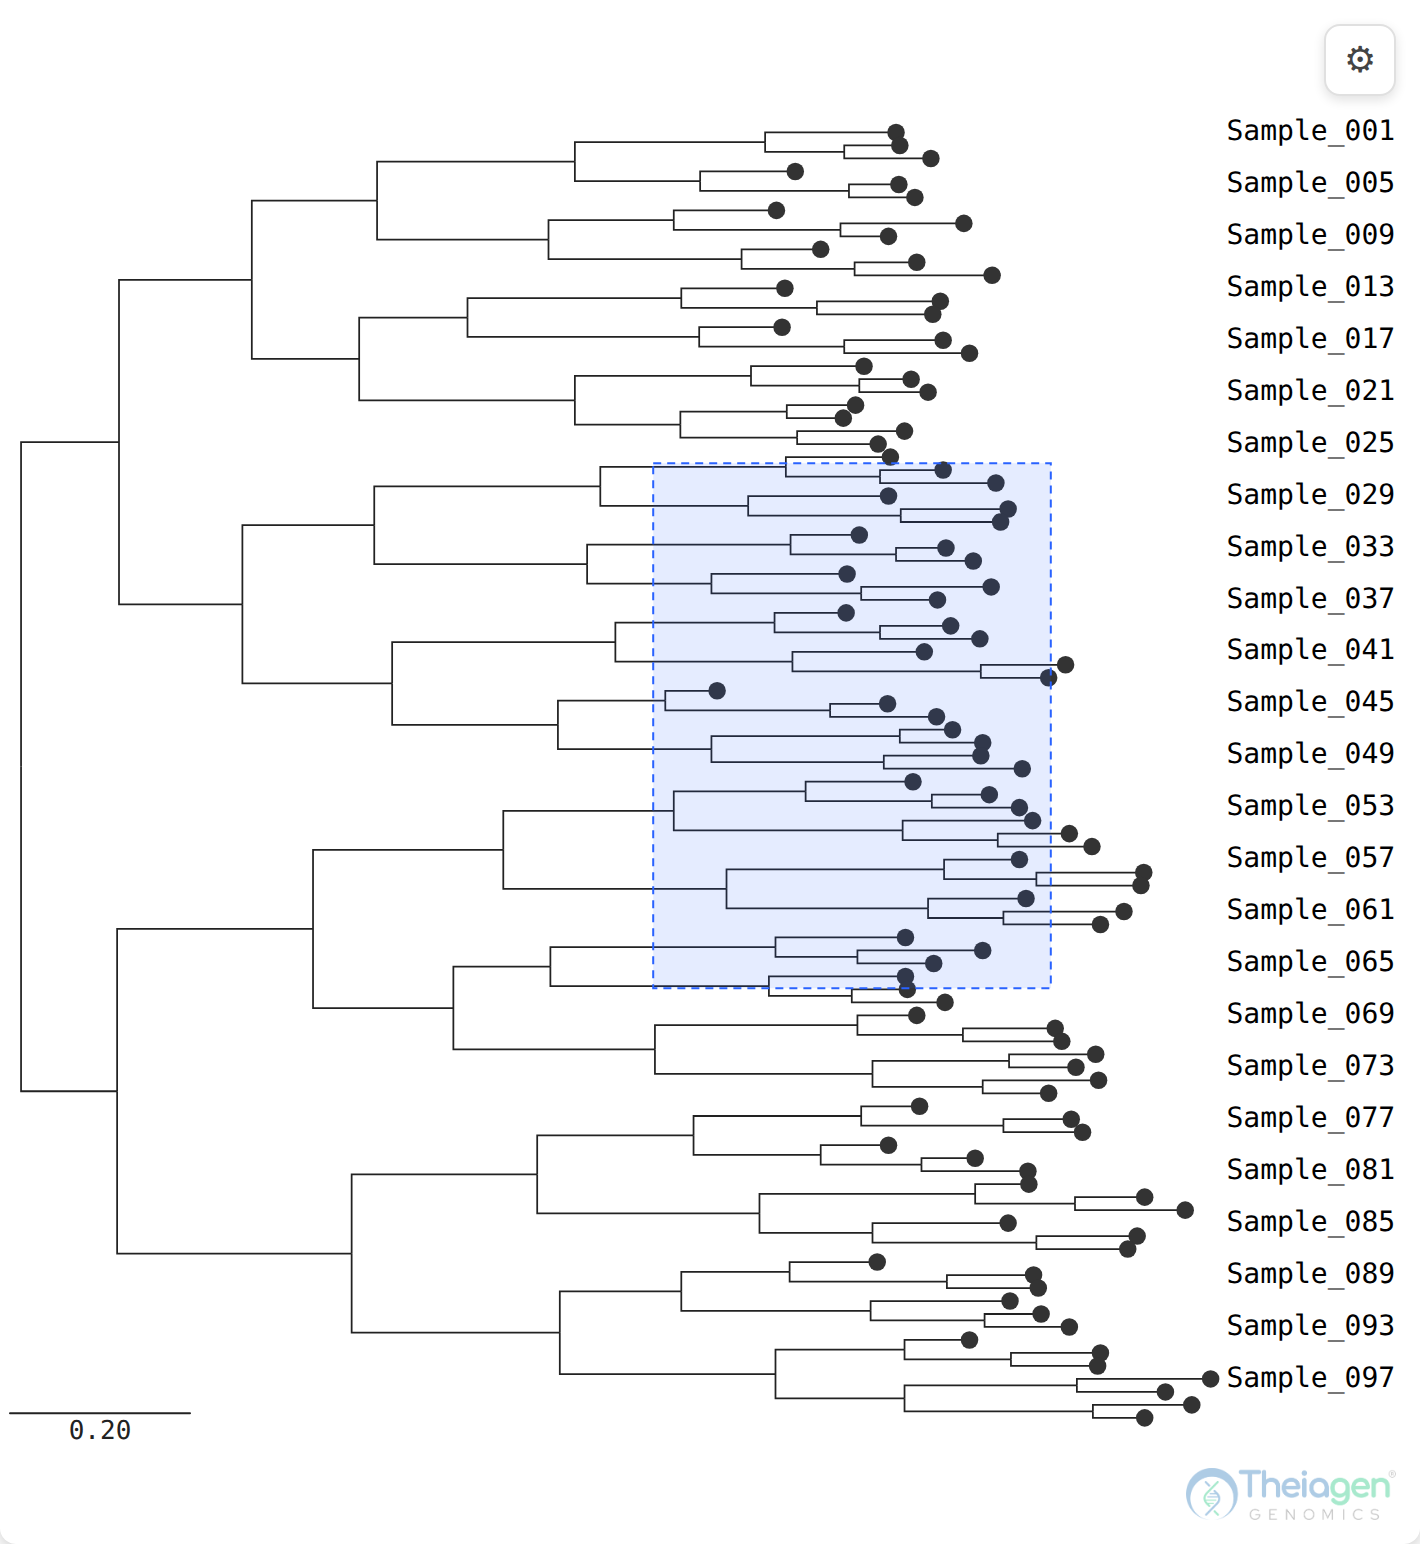
Figure 9. Selecting tips directly on the SVG tree. After choosing Box select from the right-click menu, a dashed rectangle is dragged over a clade — every enclosed tip is selected on release. Lasso select works the same way with a freehand loop.
Right-click the tree and choose Lasso select or Box select — the cursor becomes a crosshair and panning pauses while you draw. The loop or box catches a tip whether you draw around its branch tip or its label. The selection is one-shot: as soon as you release, the tips are selected and the tree returns to panning, so the menu is the single way to arm another selection. Press Esc to cancel a draw in progress.
A loop or box replaces the current selection. Hold Ctrl (Windows/Linux) or Cmd (macOS) while you draw to add the enclosed tips to what is already selected — the same modifier the table uses. However you select, it flows everywhere a click does: the matching table rows highlight, the tips are ringed on the tree, and (in Tableau) the dashboard marks update. Use Clear Selection on the tree to deselect.
Lasso and box selection are specific to the SVG renderer. Phylocanvas.gl offers its own lasso from its right-click menu (Section 11).
Sorting
Click a column header to sort by it; click again to reverse. The sort direction shows as ▲ (ascending) or ▼ (descending). One column sorts at a time.
Reading the status text
The table header reports how your data lines up:
| You see | Meaning |
|---|---|
| ✓ All N rows mapped | Every metadata row matches a tip. |
| M/N rows mapped | Only some rows match — check the label field and the golden rule. |
| ⚠ No rows mapped | Nothing matches — almost always a label-field or ID-format problem. |
| Subtree View: F/N rows | You are focused on a subtree; the table is filtered to that clade. |
| Tree-only mode (no metadata) | You loaded a tree without metadata. |
Selection flows both ways: selecting rows highlights tips, and (in Tableau) selecting marks highlights both.
9. Colouring tips by metadata
Colour-by recolours the tip markers according to a metadata field, with a matching legend so you can read the colours. Where you find the control depends on the renderer:
- TheiaPhyloViewer (SVG): open the ⚙ Appearance panel and use the Colour by dropdown at the bottom. Pick a field to colour; a legend card of value→colour swatches appears on the tree at the top-left. In the standalone viewer, click any swatch in this card to select every tip with that value — the matching rows highlight in the table too. Choose None to clear the colouring and hide the card.
- Phylocanvas.gl: open its own menu, turn on Enable Coloring, pick a field, and click the 🎨 button to choose a colour palette. Colours are kept consistent between tip markers and metadata blocks.
Your colour-by choice is saved with your settings and re-applied if you switch renderers.
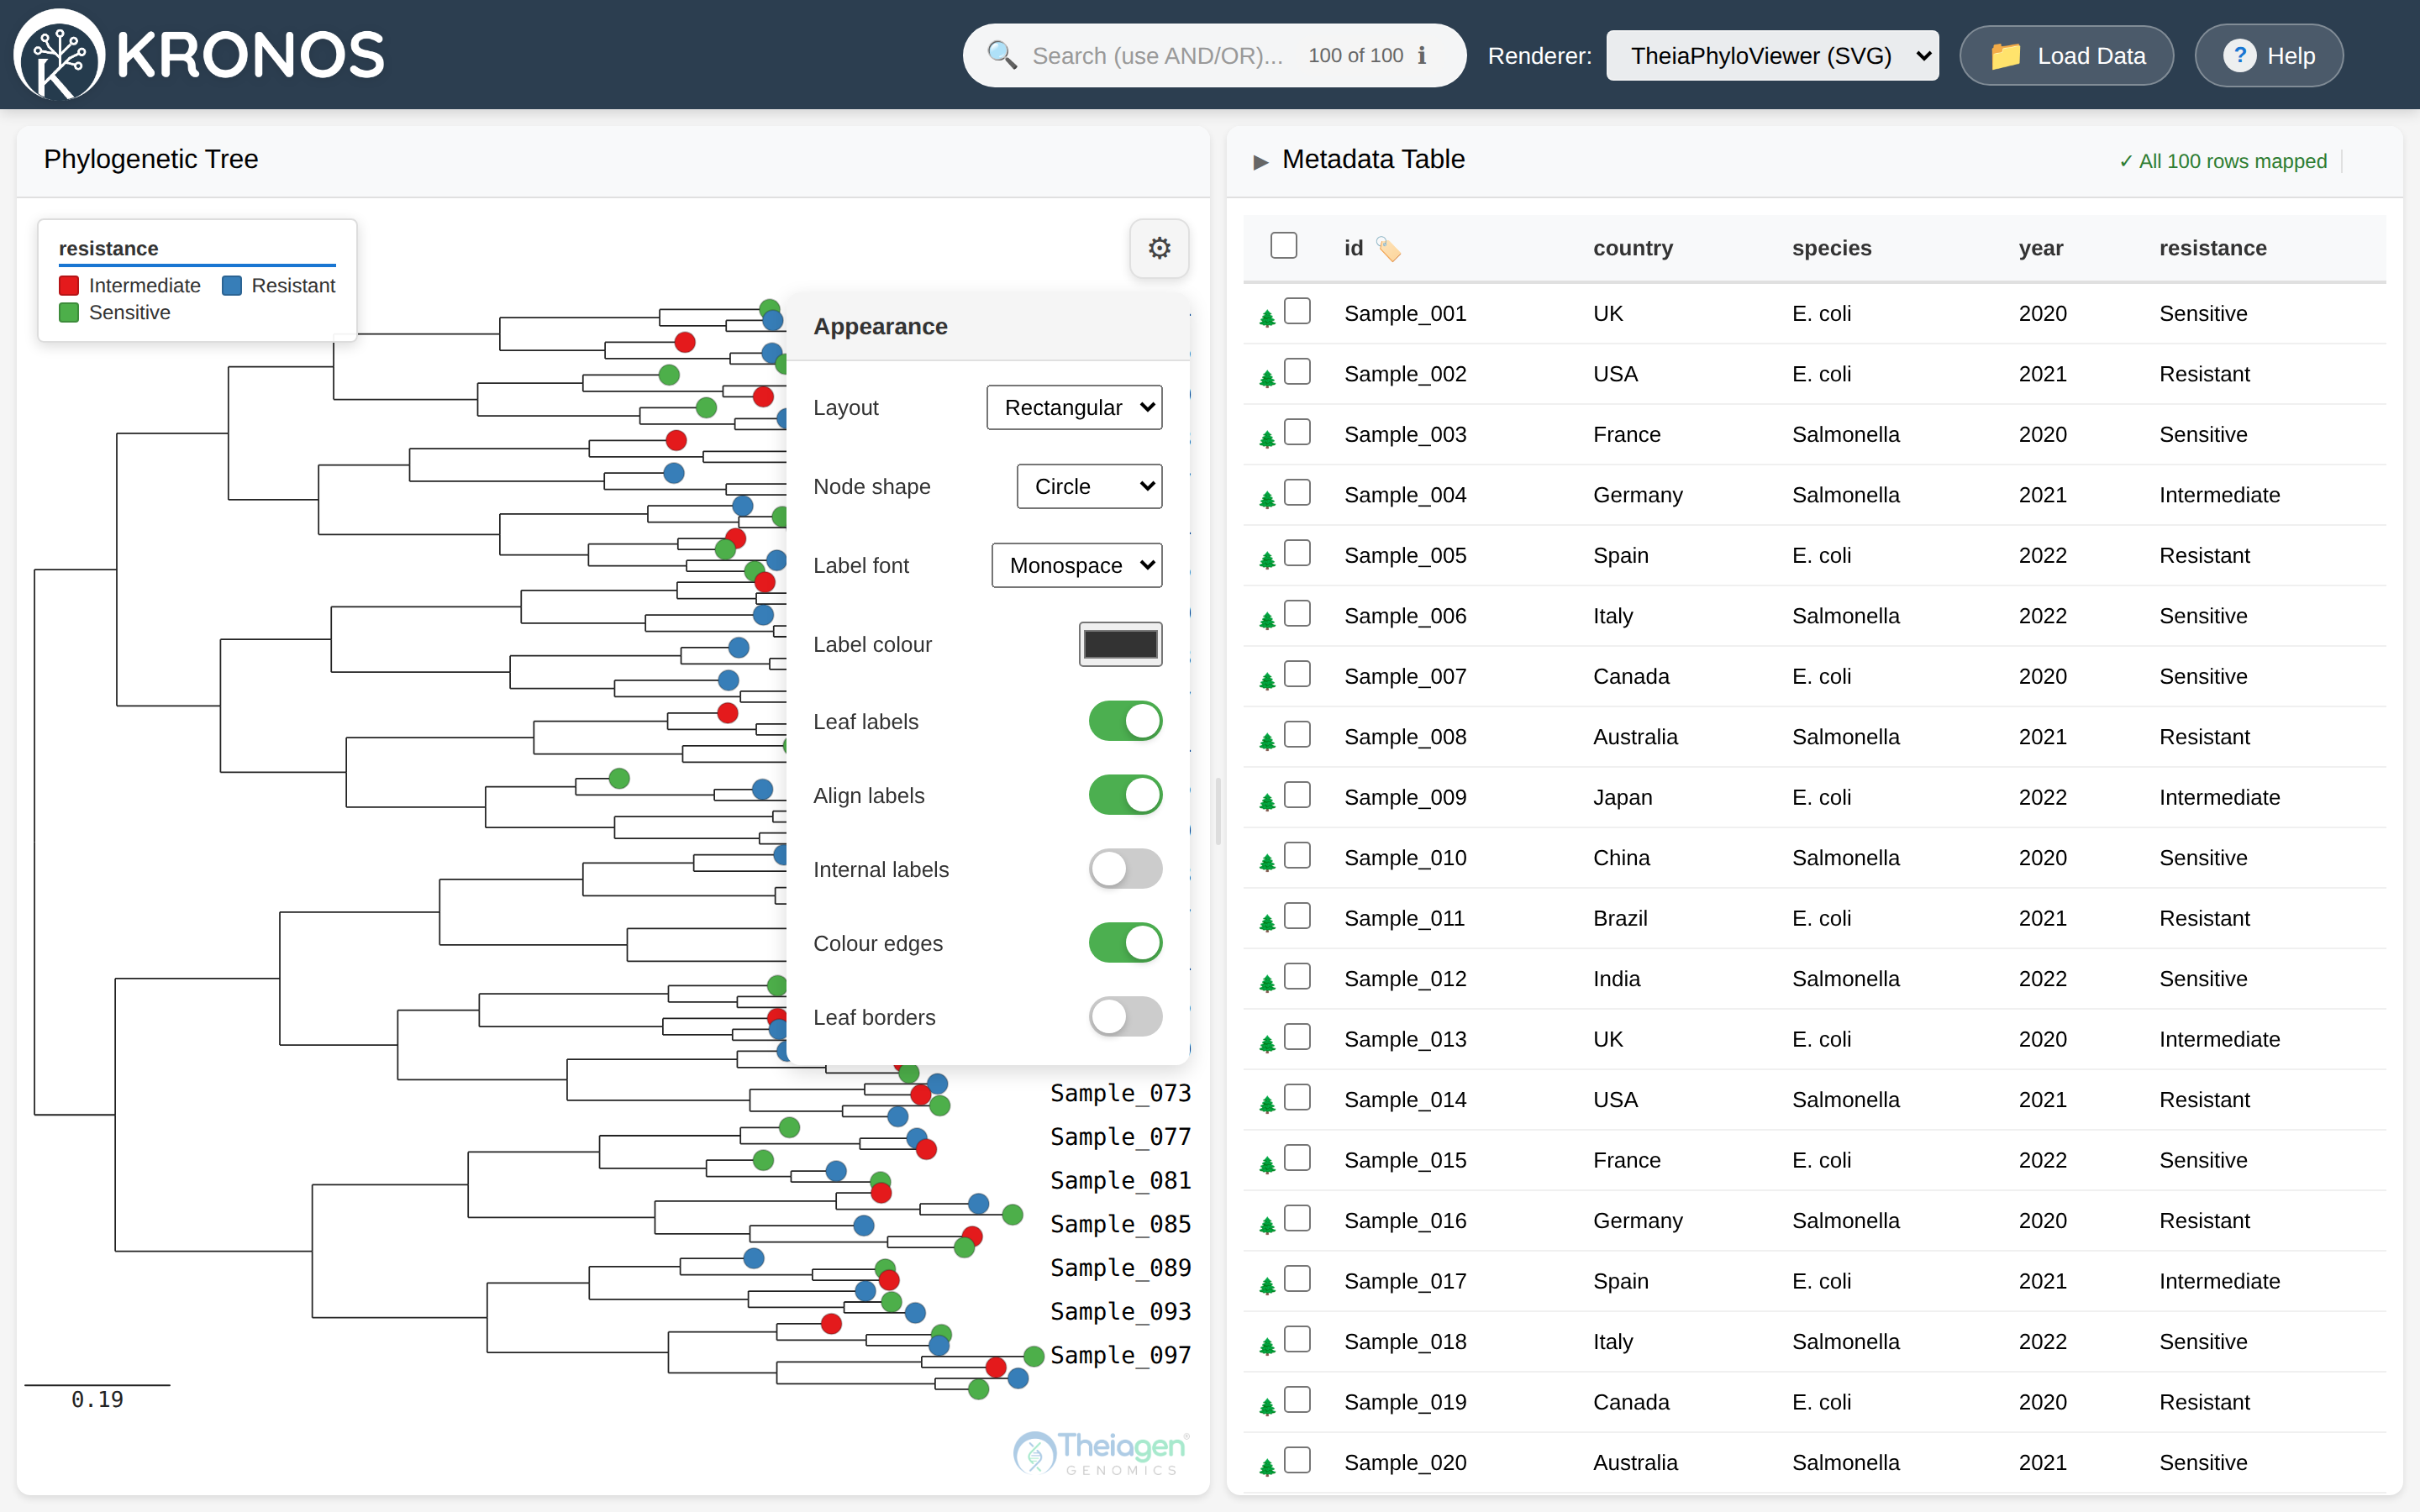
Figure 10. Colouring tips by resistance in the SVG renderer. A floating legend card (top-left) maps each value to its colour, separate from the Colour by dropdown in the panel.
10. Customising appearance (the gear panel)
This section describes the ⚙ Appearance panel of the TheiaPhyloViewer (SVG) renderer — the gear button at the top-right of the tree. (Phylocanvas.gl exposes its own, separate menu with layout, node/label size, branch-length display, metadata blocks, and tooltips.)
Every setting below is saved automatically in your browser and restored next time.

Figure 11. The ⚙ Appearance panel (SVG renderer). ① Panel header and close · ② Layout · ③ Leaf labels · ④ Node size · ⑤ Colour by.
Layout and marks
| Control | Type | Choices / range |
|---|---|---|
| Layout | dropdown | Rectangular, Radial, Circular, Diagonal, Hierarchical |
| Node shape | dropdown | Circle, Square, Diamond, Triangle, Star, Hexagon, Cross, Plus, Wye |
| Label font | dropdown | Monospace, Sans-serif, Serif, System UI, Cursive |
| Label colour | colour picker | any colour |
The Layout dropdown redraws the whole tree. The same tree is shown below in the three most common layouts, so you can see how each one reshapes the branches and labels — and because a clade annotation (added from the right-click menu, see Section 11) stays pinned to its clade through every switch, the highlighted group is easy to follow from one layout to the next:
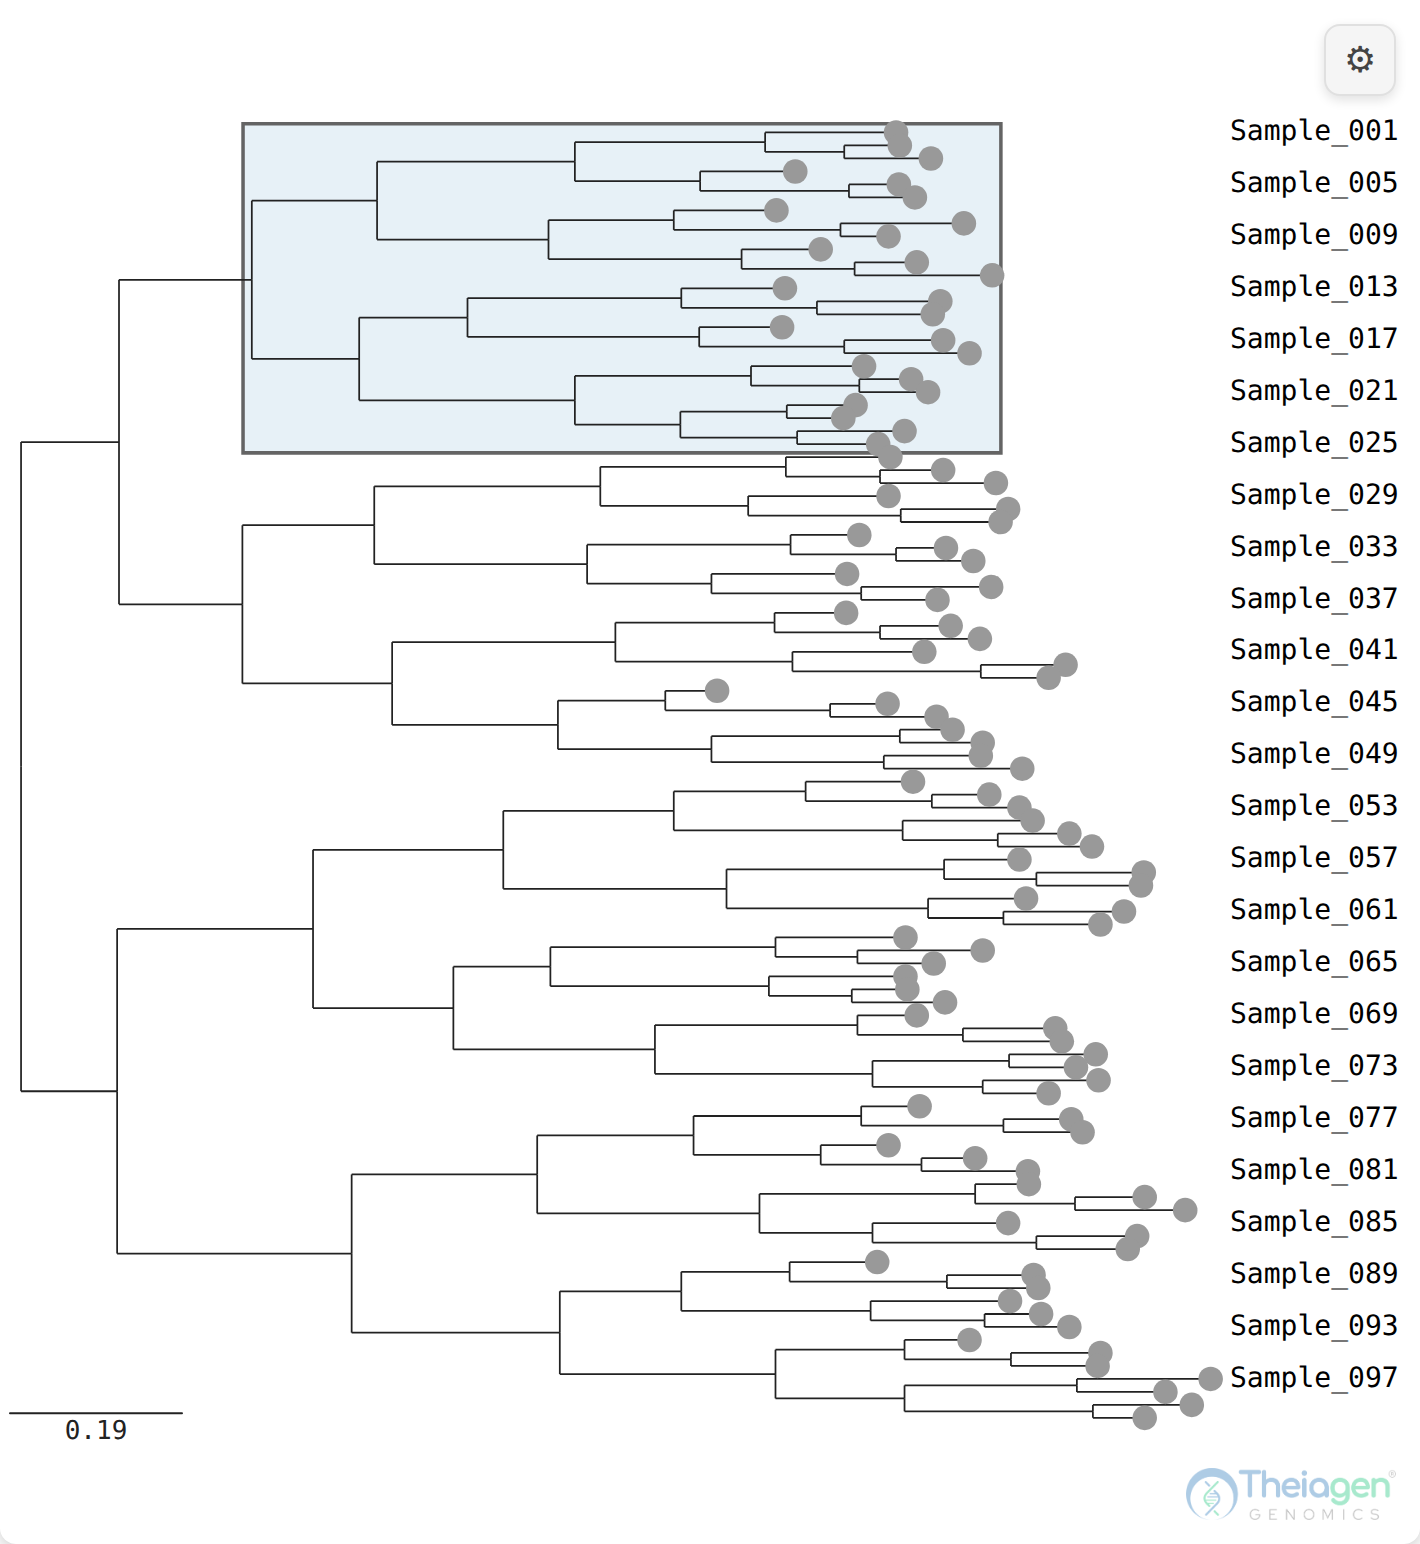
Figure 12. Rectangular layout — branches read left-to-right; the highlighted clade is a translucent box behind its tips.
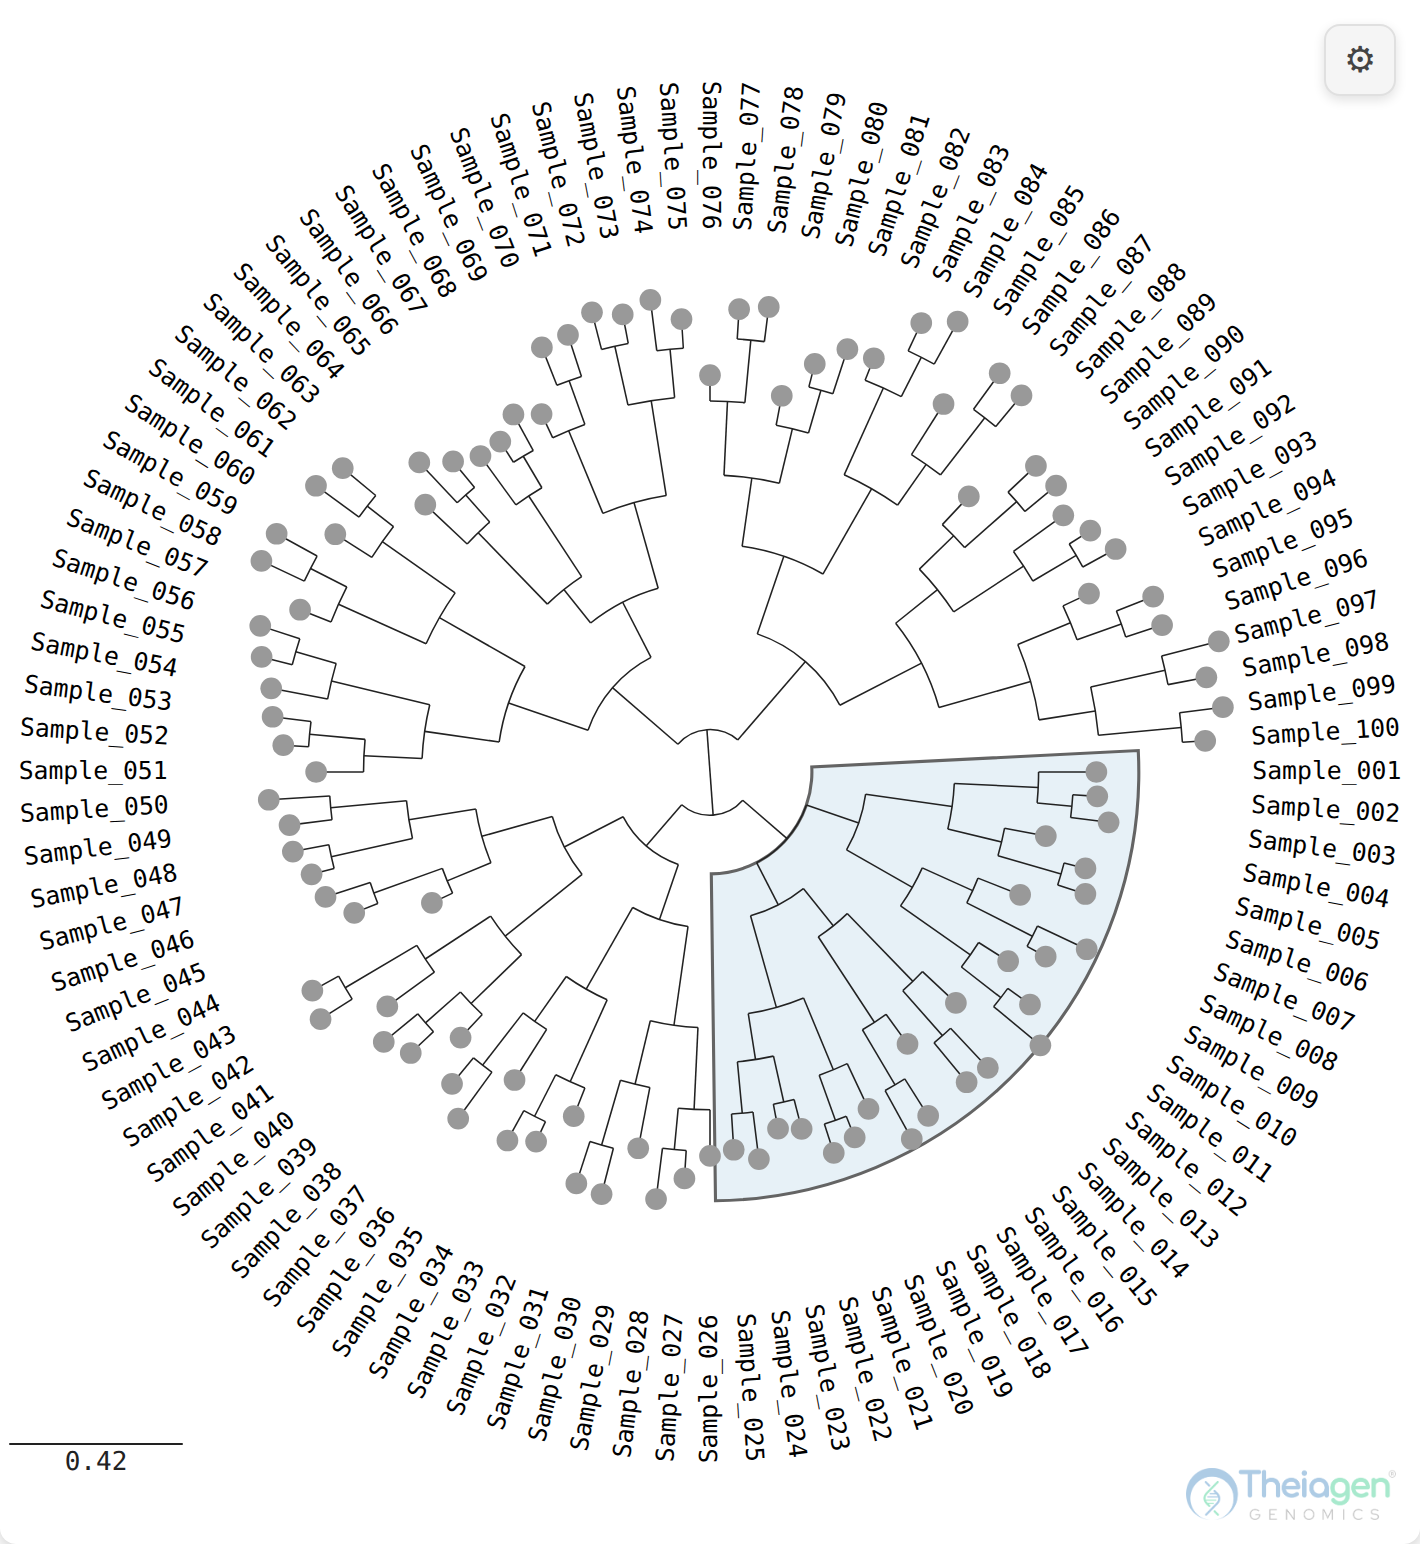
Figure 13. Circular layout — the same tree wrapped into a ring; the highlight becomes a wedge.
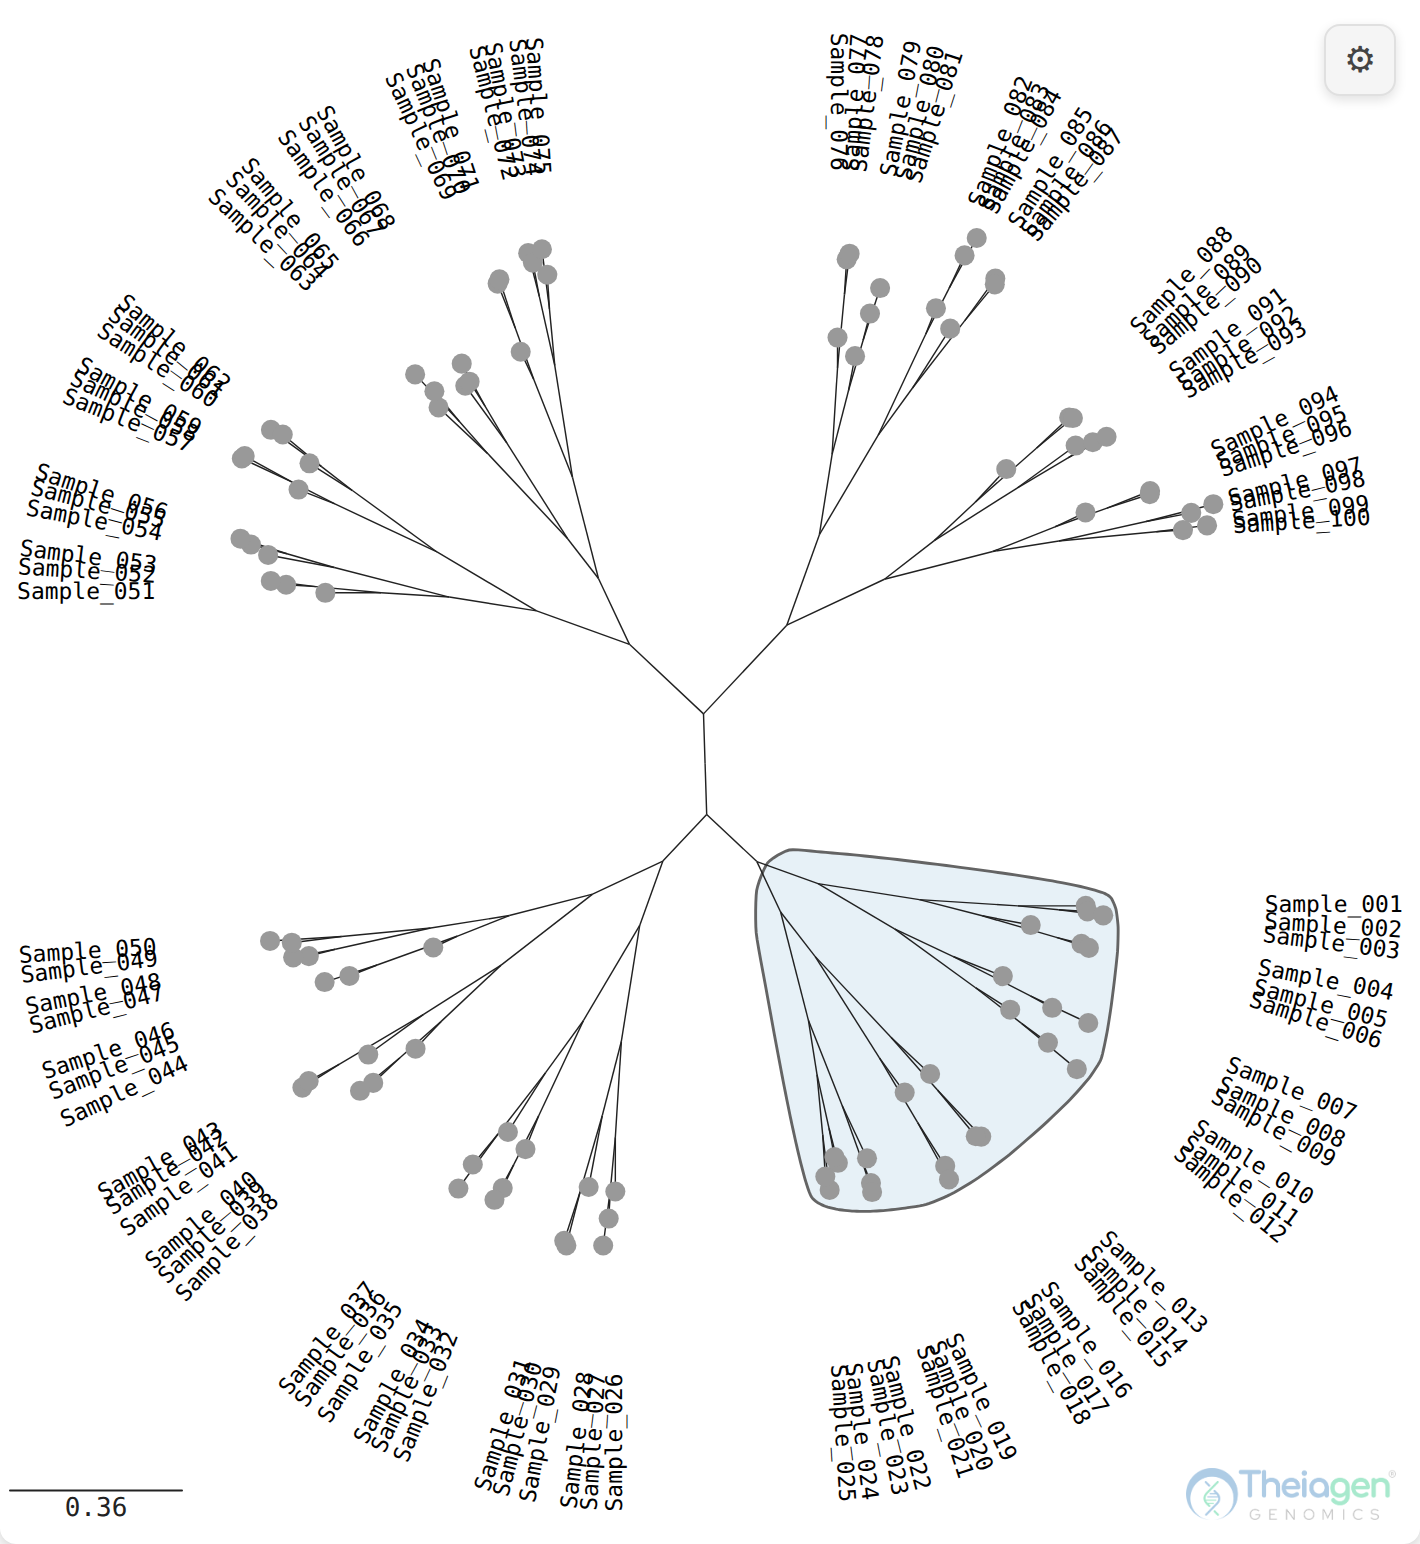
Figure 14. Radial (unrooted) layout — branches fan out from the centre; the highlight becomes a fan. Switching layout never loses your annotations.
Visibility toggles
Leaf labels, Align labels, Internal labels, Colour edges, Leaf borders, Scalebar, Pie charts (composition pie charts drawn on collapsed nodes).
Align labels is on by default: in the Rectangular, Circular, and Hierarchical layouts the tip labels line up along a common edge — a straight column or ring — instead of each ending at its own branch tip, which makes them easier to scan. The Radial and Diagonal layouts always draw labels at the branch tips, so the toggle has no effect there. Switch it off to anchor each label to its own branch tip.
Sizes
| Control | Range |
|---|---|
| Node size | 2–40 px |
| Label size | 6–48 px |
| Internal label size | 6–48 px |
| Internal label range | two optional boxes (min / max) — show internal labels only for values within a numeric range; leave either blank to disable the filter |
Selection highlight (halo)
| Control | Range |
|---|---|
| Halo colour | colour picker |
| Halo radius | 0–40 |
| Halo width | 0–20 |
Metadata blocks
Beside the tips you can draw a row of coloured blocks — one column per metadata field — so several fields read straight off the tree like a compact heat-map. Under Metadata blocks in the panel, tick each field you want as a column; every value takes a colour from the active palette (shared with the Colour by legend). A floating legend in the bottom-right corner of the tree maps each block colour back to its value, so the columns stay readable at a glance. In the standalone viewer, click any swatch in that legend to select every tip with that value — the matching rows highlight in the table too. Untick a field to drop its column, and set the column width with Block size (below).
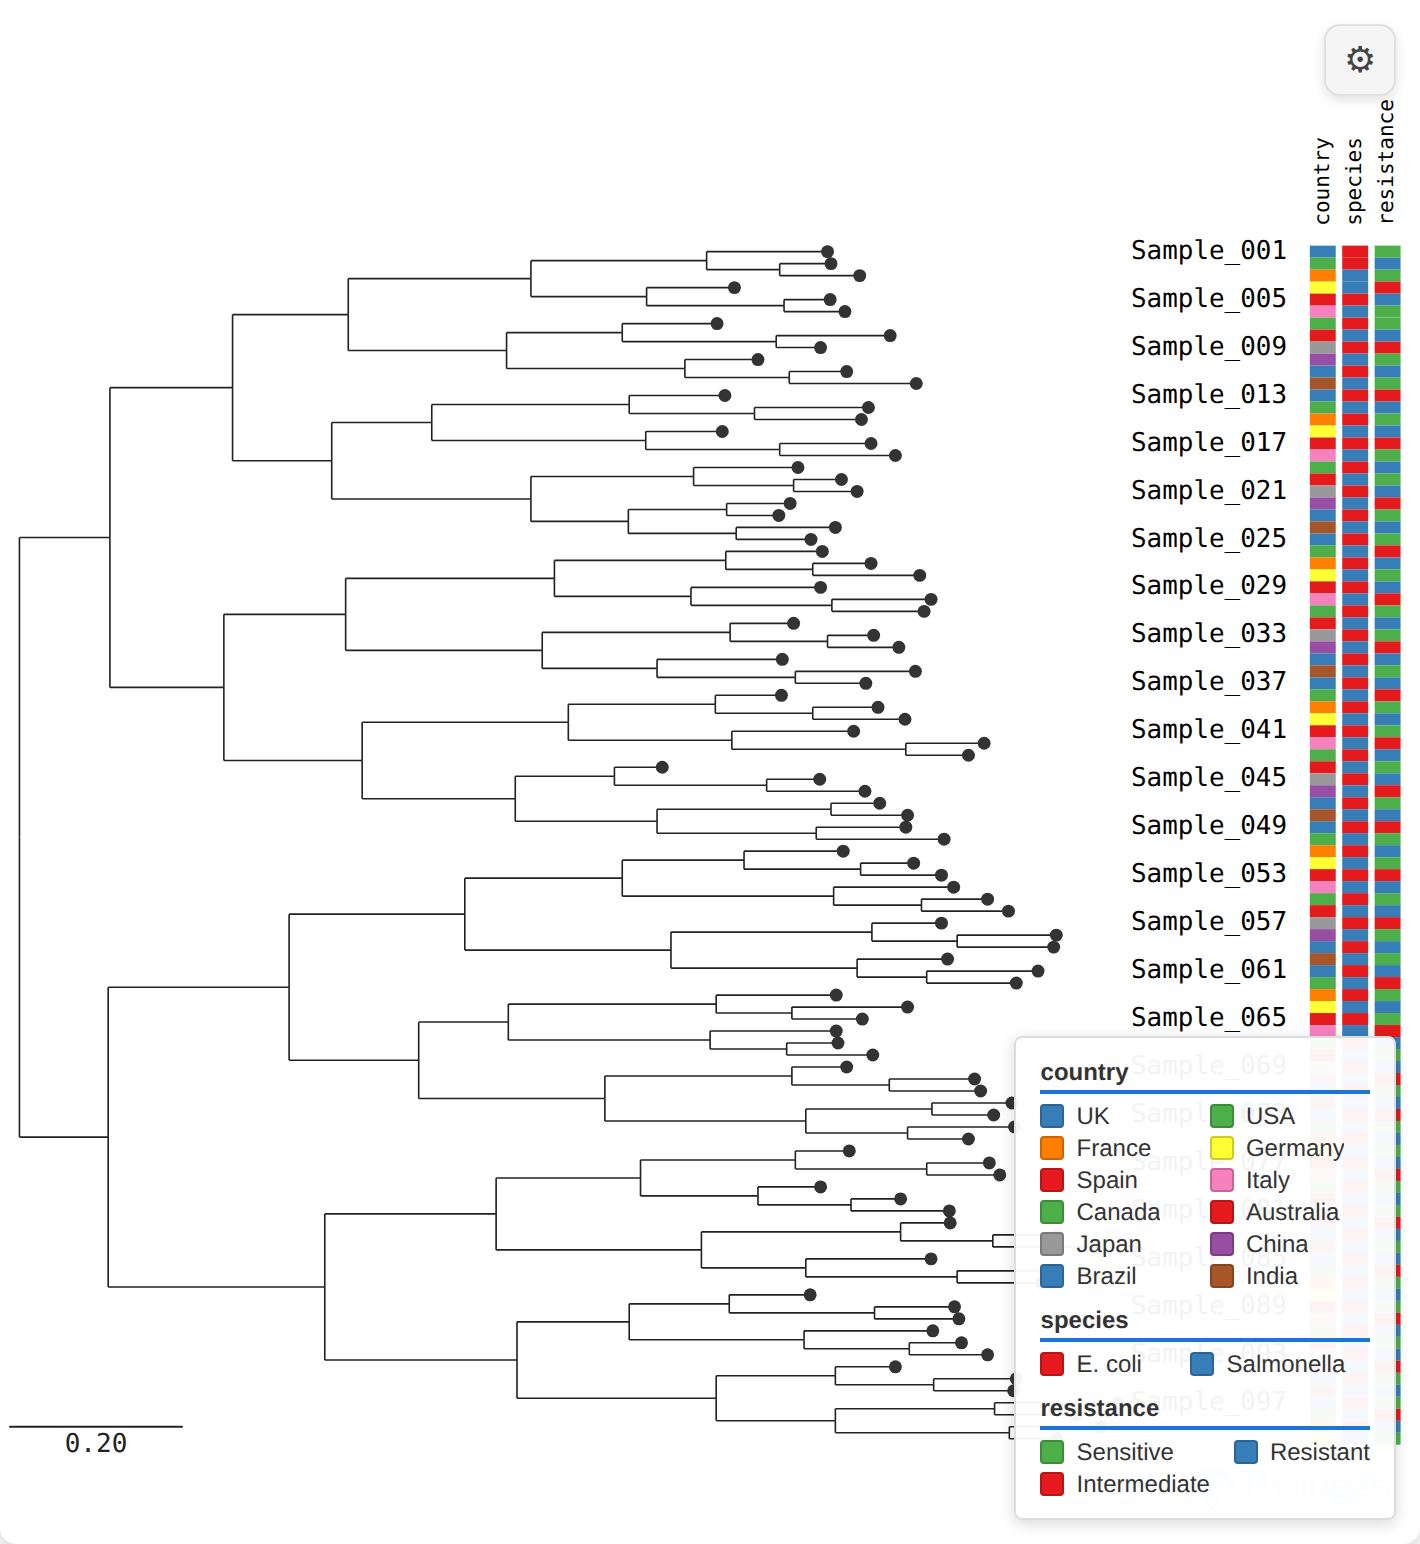
Figure 15. Metadata blocks in the SVG renderer: country, species and resistance drawn as coloured columns beside the tips, with a bottom-right legend mapping each colour to its value. Tick fields under Metadata blocks in the Appearance panel to add or remove columns.
Spacing and blocks
| Control | Range |
|---|---|
| Padding | 0–100 (whitespace around the tree) |
| Block size | 2–48 px (size of metadata colour blocks beside tips) |
Scale bar
| Control | Range |
|---|---|
| Scalebar digits | 0–6 (decimal places on the scale-bar label) |
| Scalebar width | 40–200 px |
| Scalebar font size | 6–24 px |
| Scalebar opacity | 0–100% |
| Scalebar colour | colour picker (sets both the bar and its label) |
Zoom
| Control | Range | Saved? |
|---|---|---|
| Branch zoom | 0.25×–16× | Yes (layout) |
| Step zoom | 0.25×–16× | Yes (layout) |
| Zoom | 0.25×–16× relative to fit | No (transient) |
Colour by
A Colour by dropdown (None + every metadata field) with a swatch legend, as described in Section 9.
11. Reshaping and annotating the tree
Right-click the tree for a context menu. The two renderers offer different menus.
TheiaPhyloViewer (SVG) menu
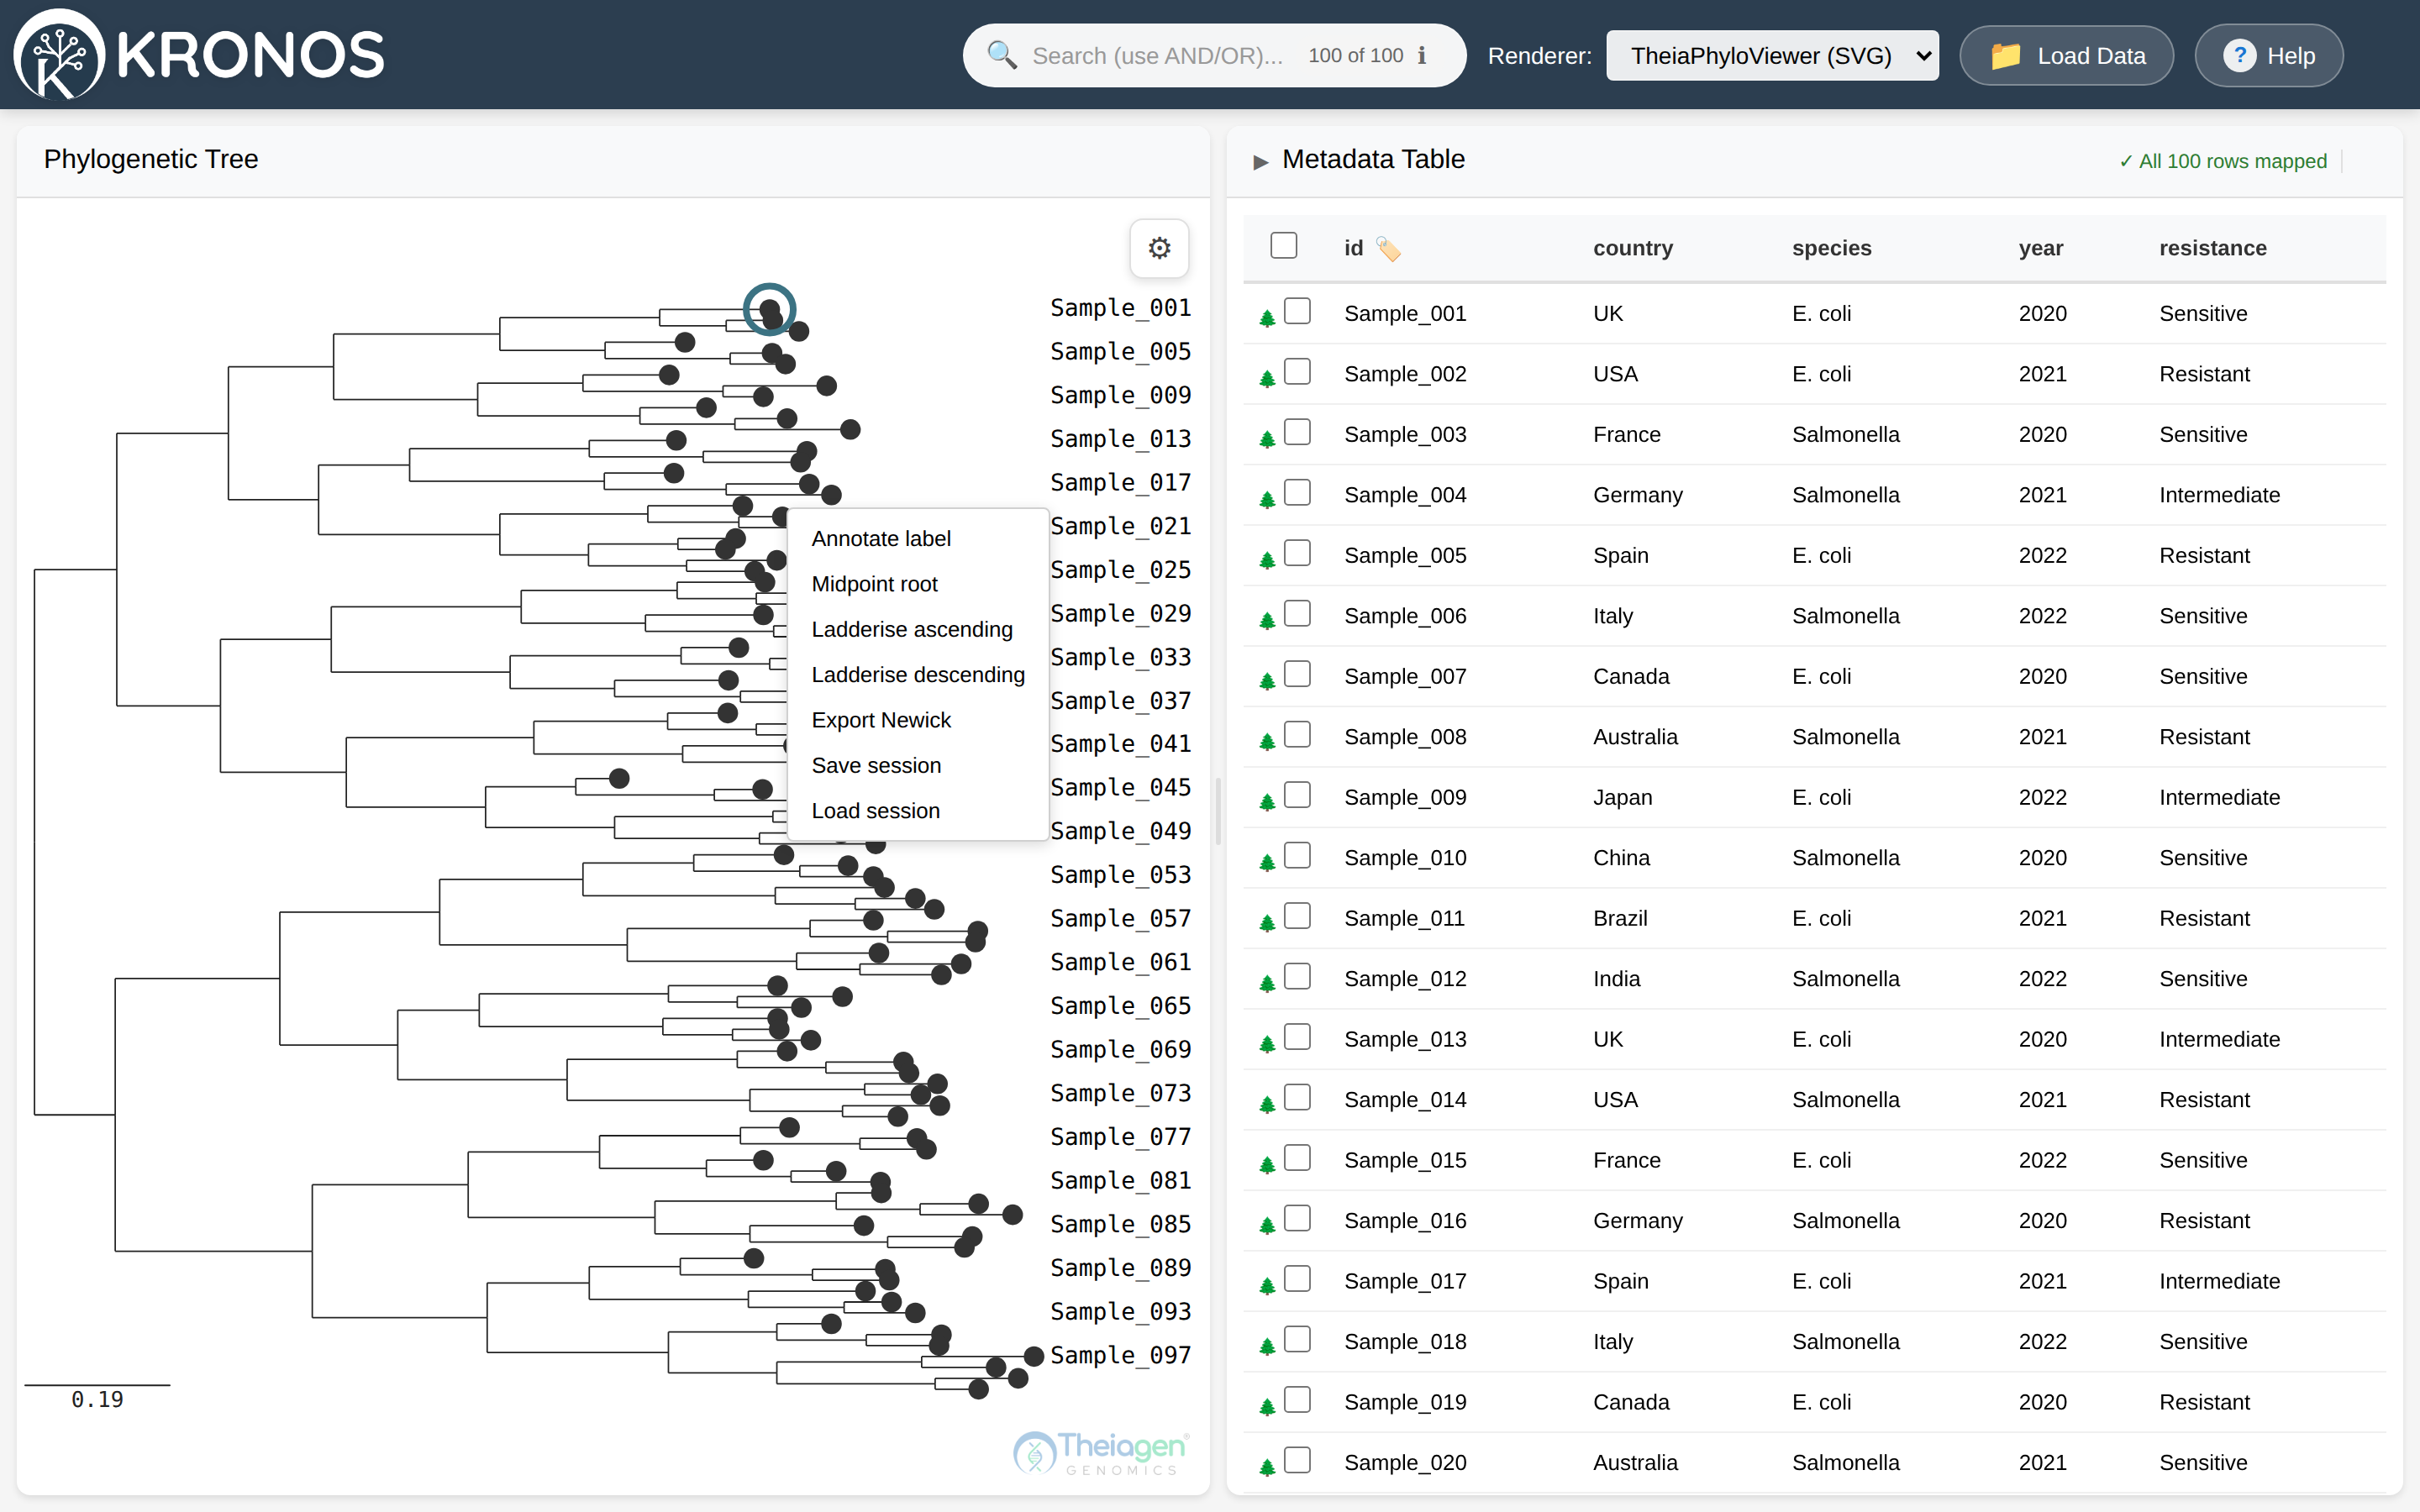
Figure 16. The SVG right-click menu. The items offered depend on where you click — an internal node, a tip, or empty space.
What you see depends on where you right-click.
On an internal node (a branch point):
| Item | What it does | Reversible? |
|---|---|---|
| View subtree | Re-anchors the display to that clade and filters the table/dashboard to its tips. Distances are preserved; the tree is not structurally re-rooted. | Yes — Reset view. |
| Collapse / Expand | Folds the subtree to a single marker, or unfolds it. Topology is untouched. | Yes. |
| Rotate | Flips the order of the node’s children. Cosmetic; distances unchanged. | Yes (rotate again). |
| Re-root here | Structurally re-roots the tree at that branch, preserving distances. Resets collapses, clears any subtree filter, and refits. Hidden on the current root. | Re-root elsewhere / midpoint root. |
| Annotate clade / Remove annotation | Draws a translucent coloured box behind the subtree; repeat to cycle the palette. Saved with the session. | Yes — Remove annotation. |
Re-root here is the most structural of these actions. It changes which branch sits at the base of the tree, re-hanging everything around the chosen point while leaving individual branch lengths unchanged:
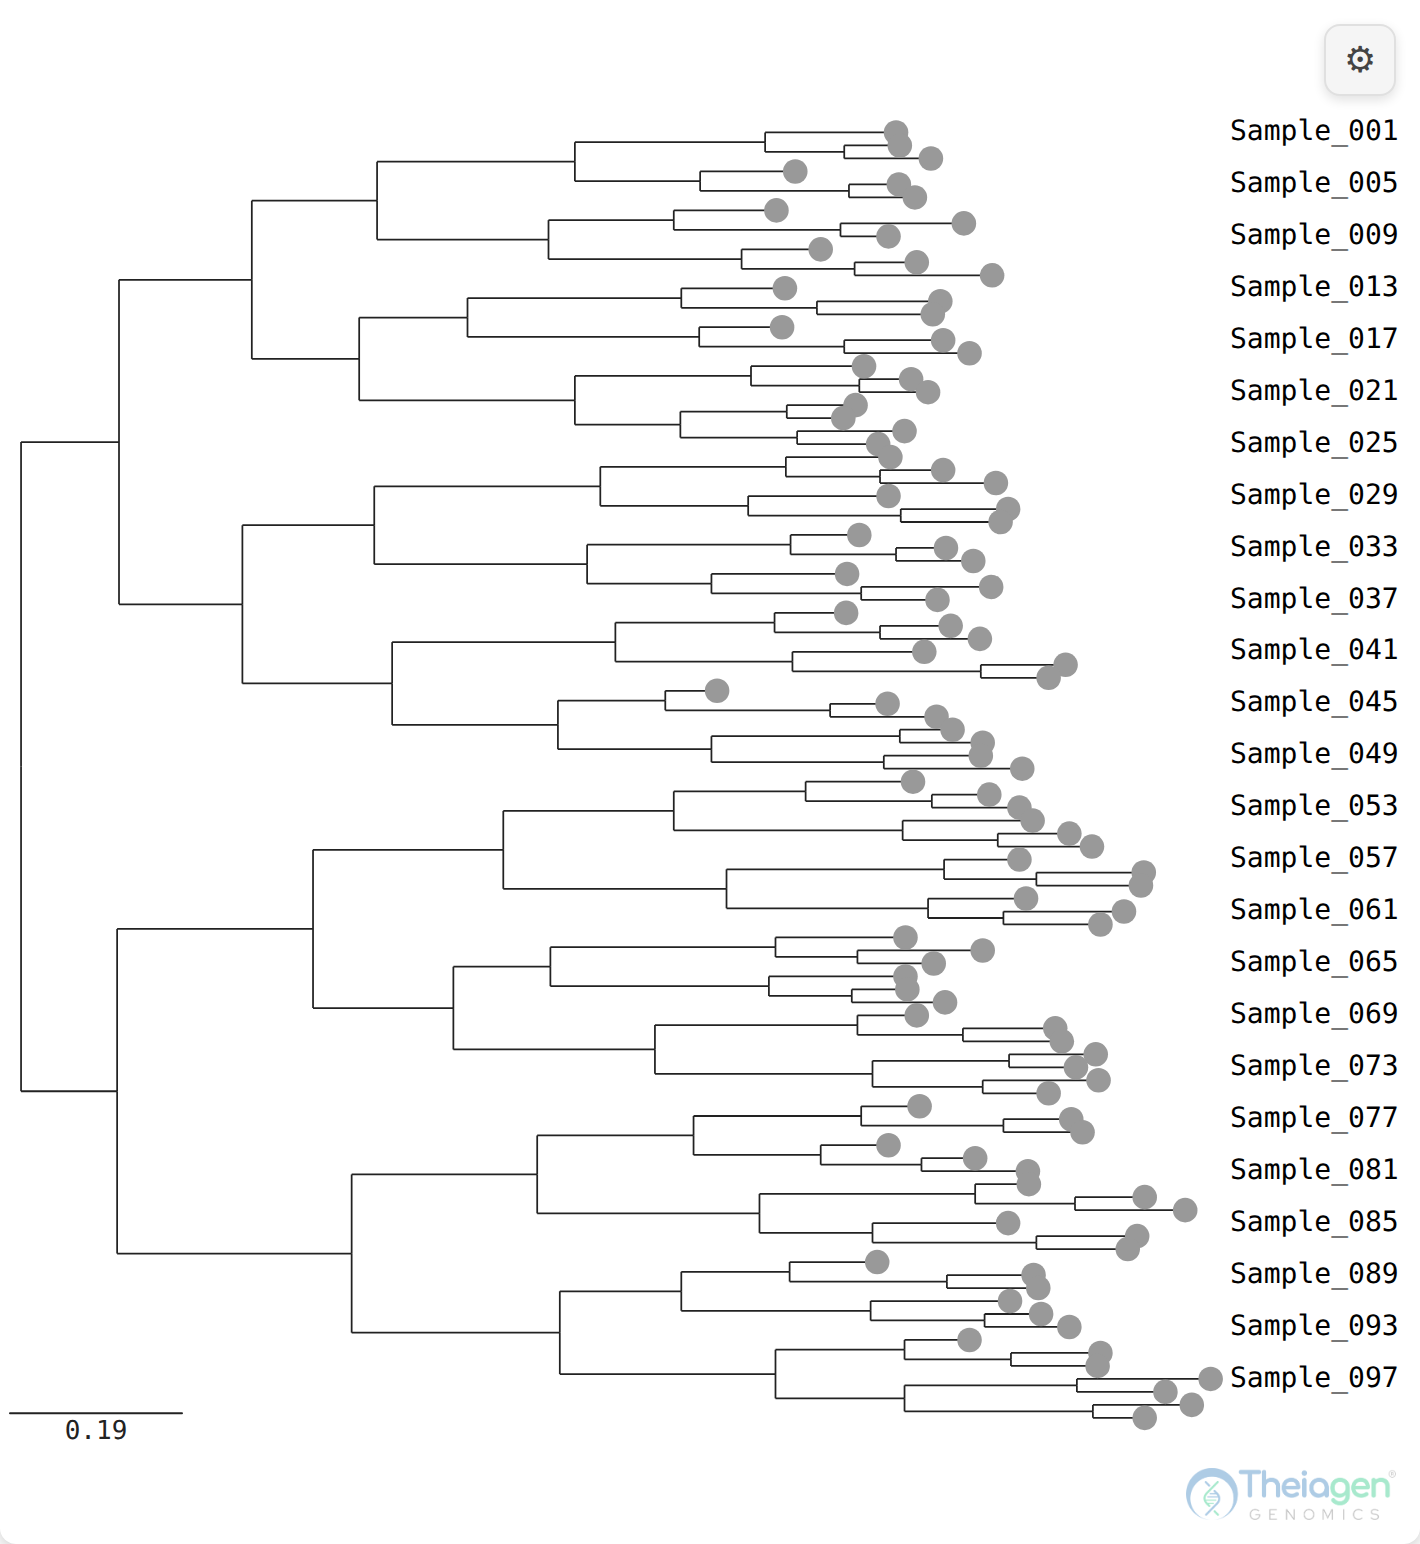
Figure 17. Before re-rooting — the demo tree at its original root.
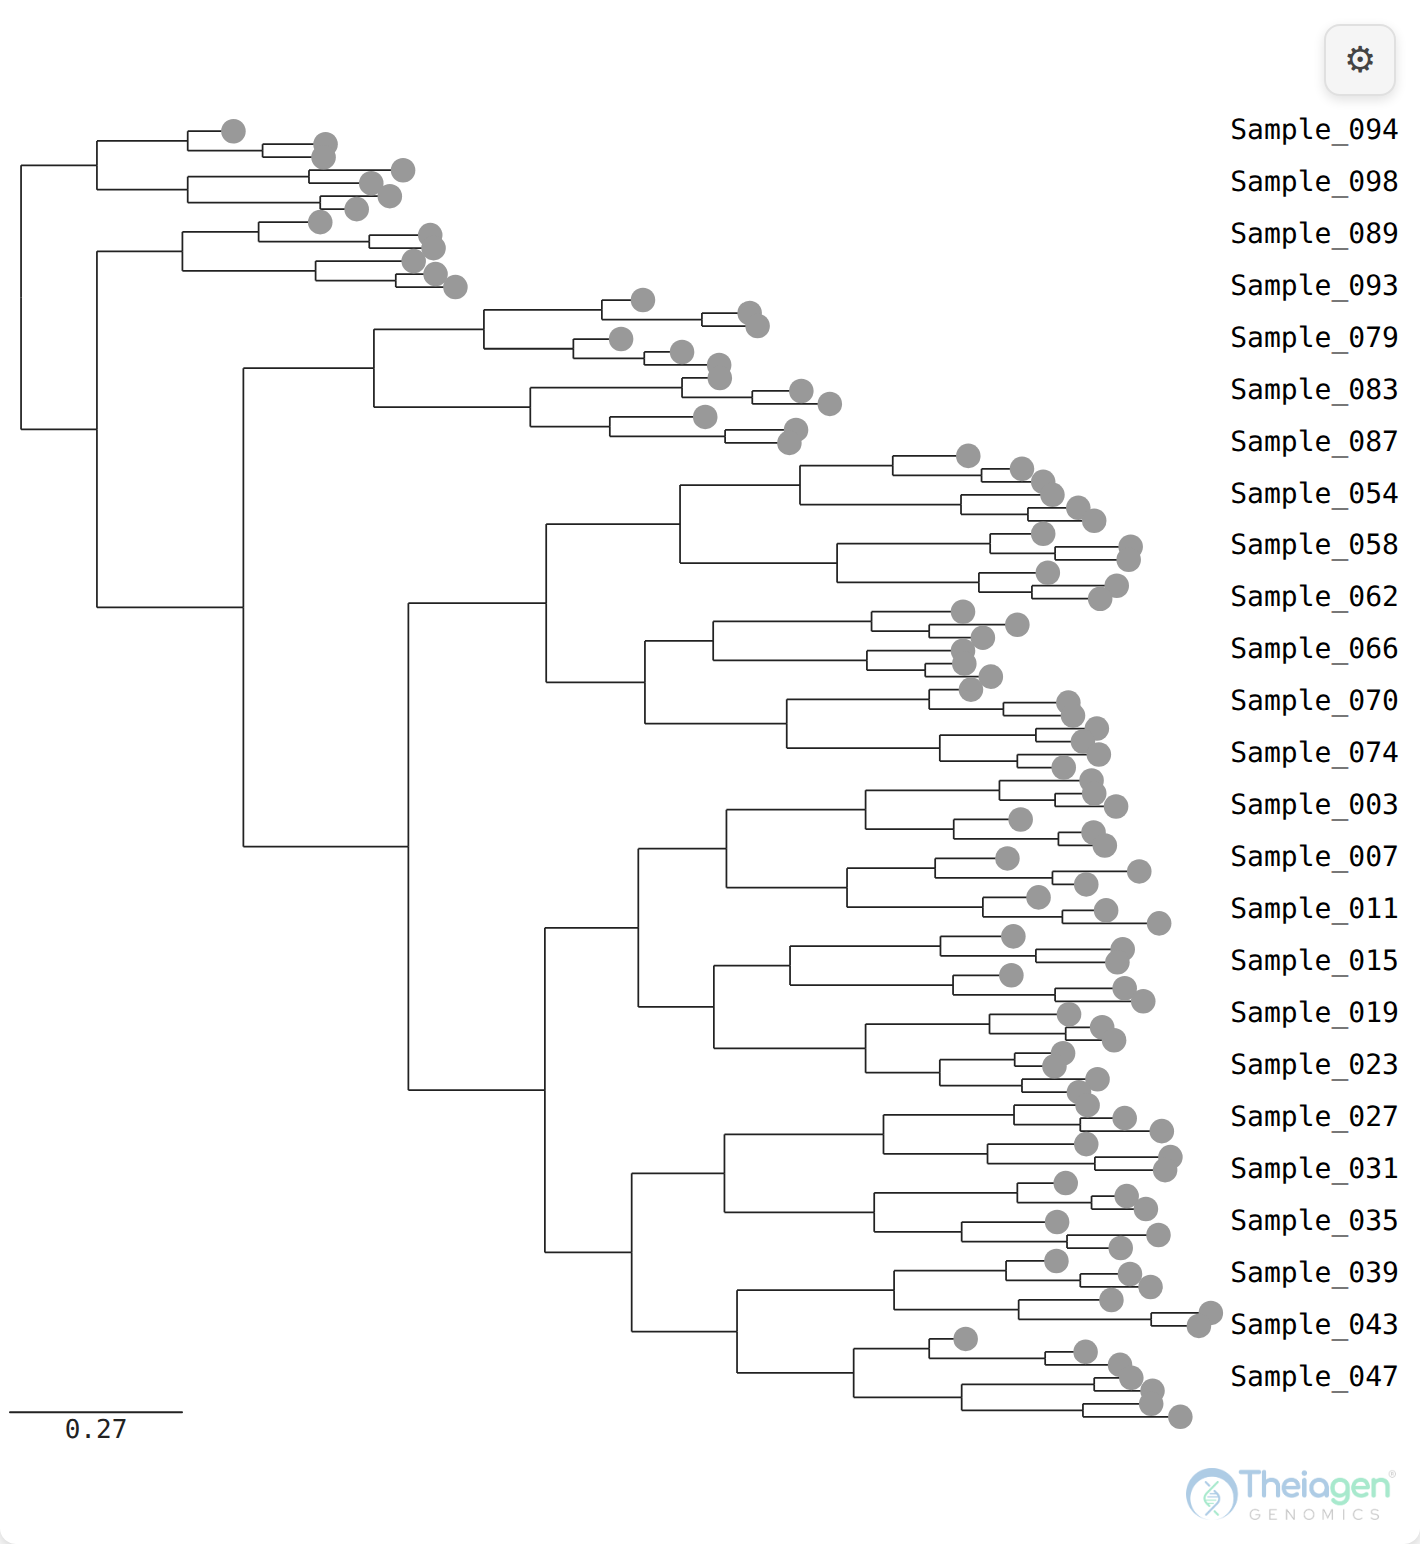
Figure 18. After Re-root here on a deep branch — the tree re-hangs with a new group at the base. Individual branch lengths are unchanged; only the position of the root differs.
On a tip (leaf):
| Item | What it does |
|---|---|
| Annotate label / Remove label band | Draws a coloured band in the label gutter beside that tip; cycles the palette. Saved with the session. |
Anywhere (global actions), shown when applicable:
| Item | What it does |
|---|---|
| Midpoint root | Auto-roots at the midpoint of the longest tip-to-tip path. Resets collapses, clears subtree filter, refits. |
| Ladderise ascending / Ladderise descending | Reorders children by subtree size for a tidy “ladder.” Structural re-hang; resets collapses, clears filter, refits. |
| Lasso select / Box select | Switches the tree into freehand-loop or rectangle tip selection (see Section 8). Shown when a tree is loaded. |
| Expand all | Unfolds every collapsed node (shown when anything is collapsed). |
| Reset view | Leaves subtree focus and restores the whole tree (shown when a subtree view is active). |
| Export Newick | Downloads the current topology as tree.nwk, reflecting your edits. |
| Save session / Load session | Saves/restores everything (see Section 12). |
Phylocanvas.gl menu
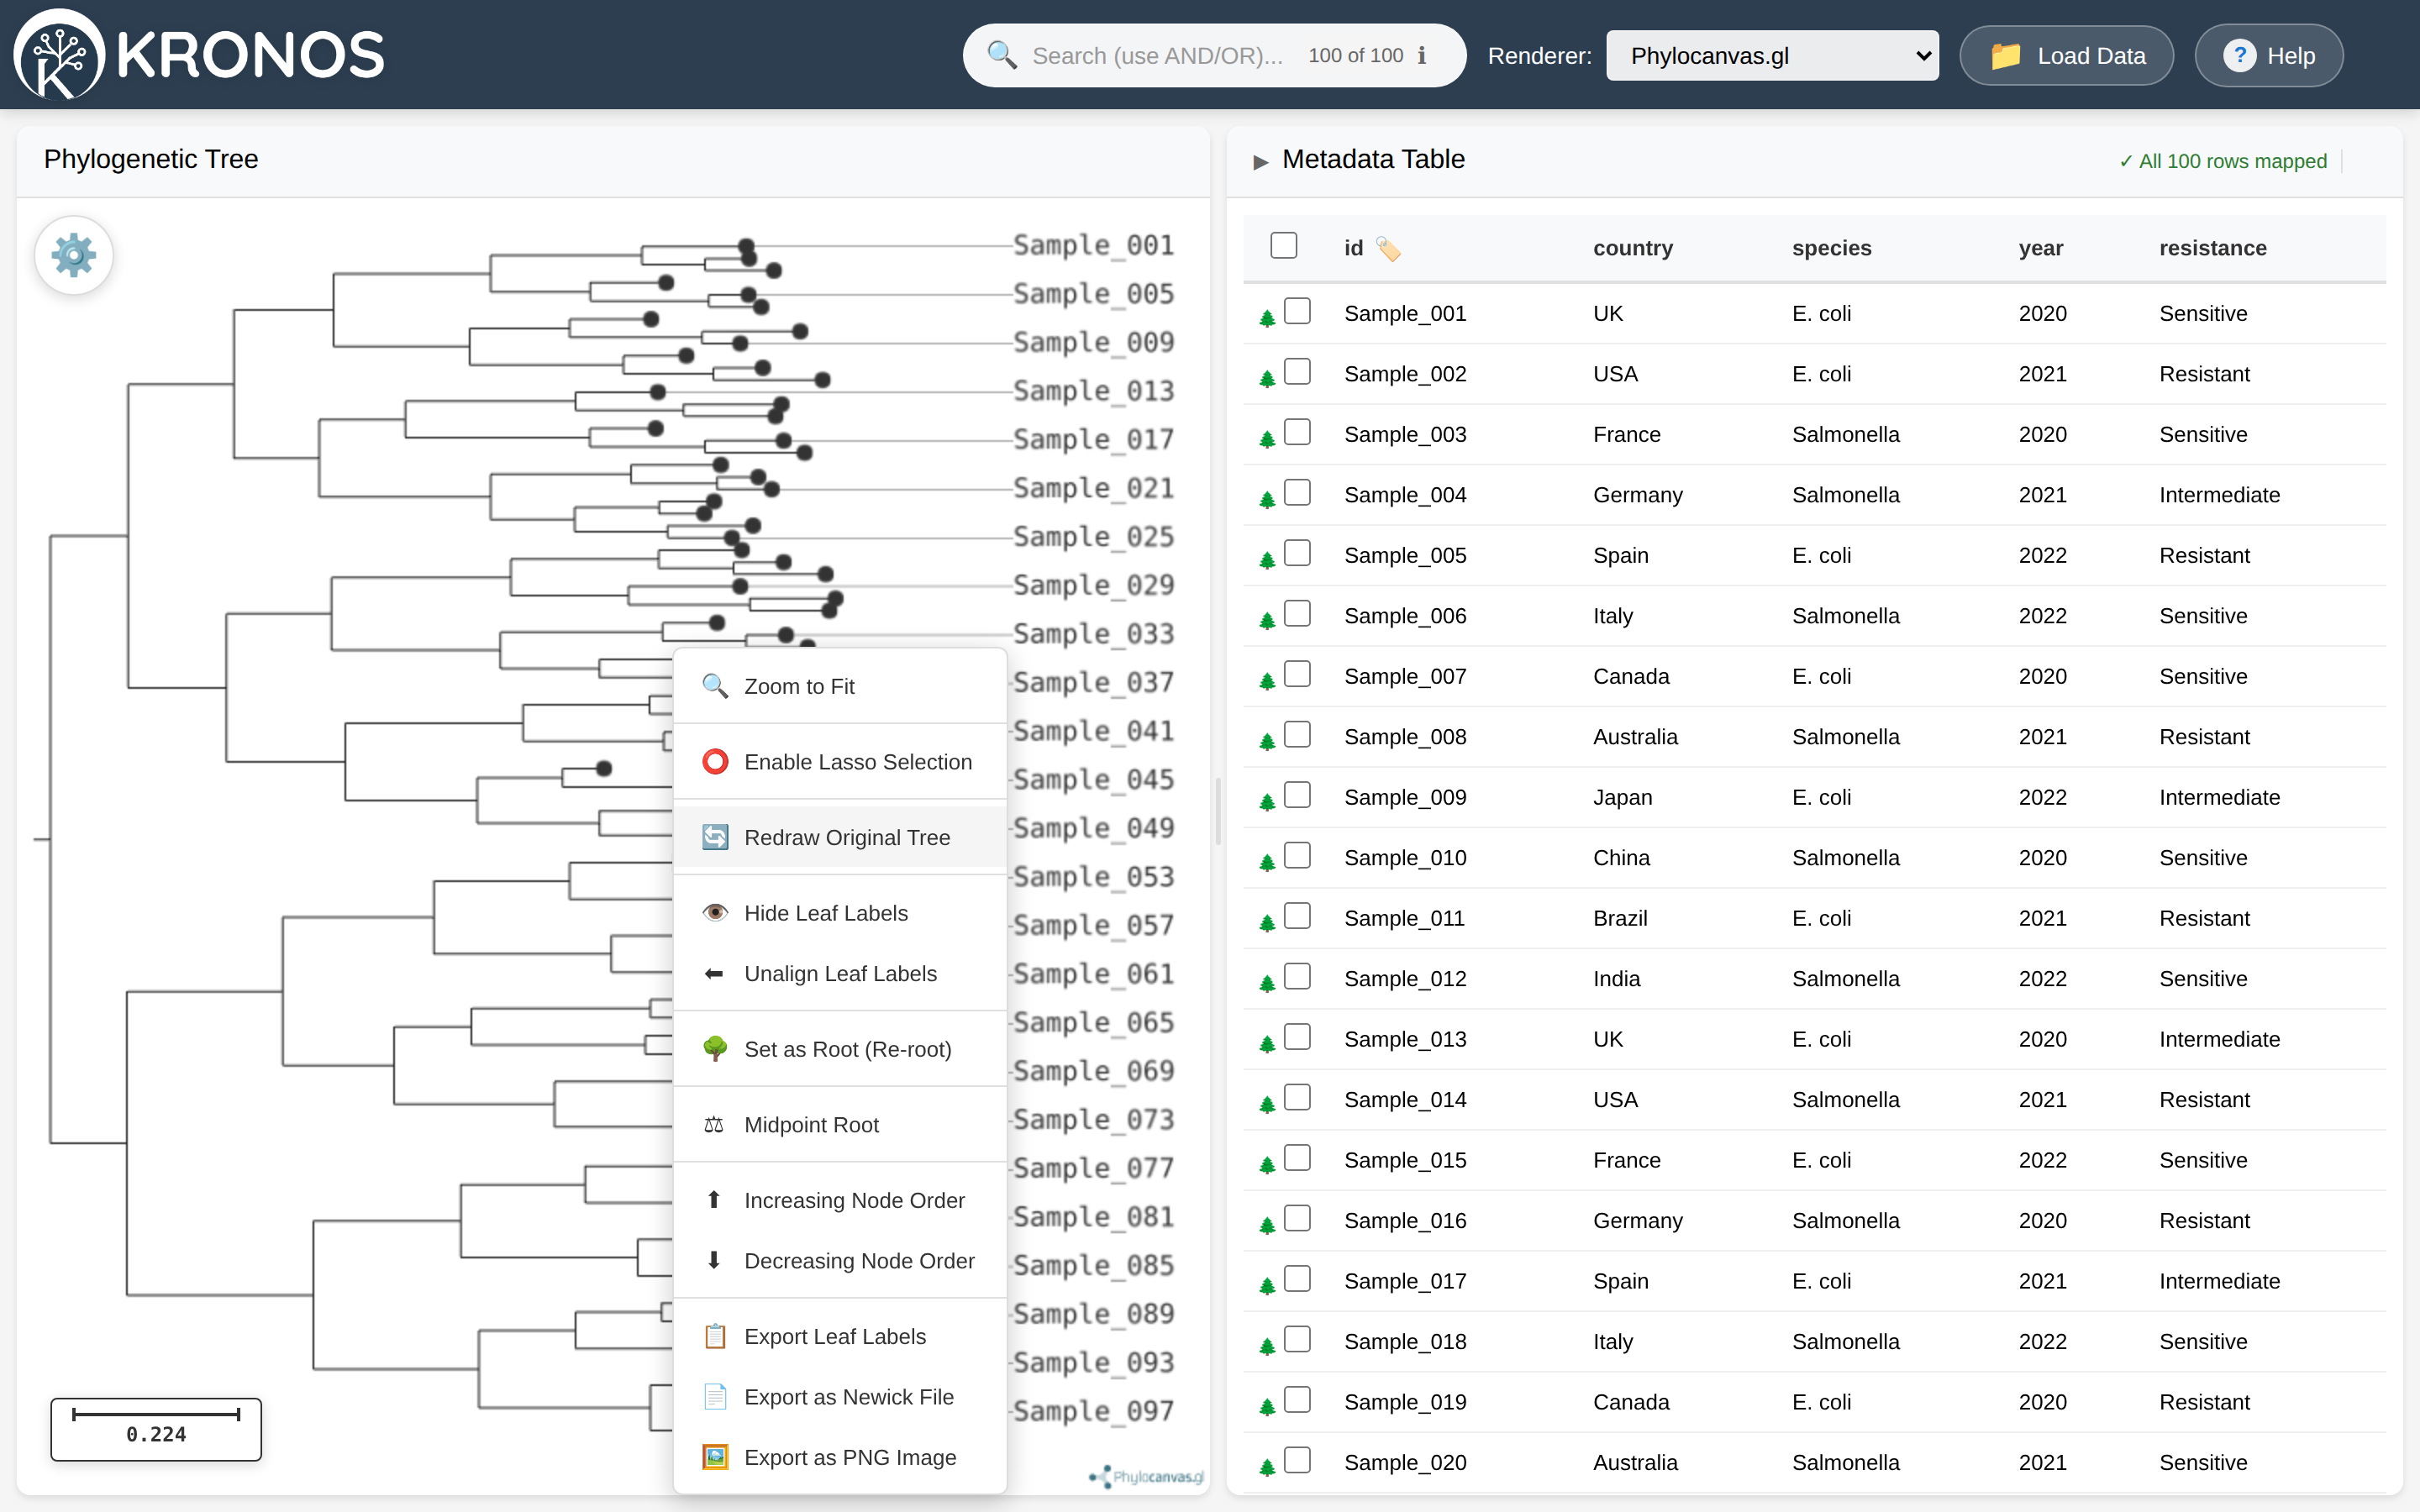
Figure 19. The Phylocanvas.gl right-click menu, including Zoom to Fit, lasso selection, and PNG/Newick export.
On the canvas / a tip:
Zoom to Fit · Enable Lasso Selection (toggle) · Redraw Original Tree · Hide/Show Leaf Labels · Unalign Leaf Labels · Set as Root (Re-root) · Midpoint Root · Increasing Node Order · Decreasing Node Order · Export Leaf Labels · Export as Newick File · Export as PNG Image.
On an internal node:
Enable Lasso Selection · View Subtree · Collapse Subtree · Rotate Subtree · Set as Root (Re-root) · Export Leaf Labels · Export as Newick File.
Lasso selection (Phylocanvas.gl) lets you drag a freehand loop to select many tips at once — handy for grabbing a visual cluster.
12. Saving and exporting your work
Kronos keeps your work in several complementary ways.
Automatic (settings persistence)
In the standalone viewer, your renderer choice and every appearance setting are stored in your browser automatically and restored on your next visit — no action needed. (Clearing your browser storage resets them.)
Session files (SVG renderer)
Right-click → Save session writes a tree-session.json capturing:
- the tree topology at full precision (including any re-roots/ladderise),
- every appearance setting,
- collapse state and clade/label annotations,
- the current pan and zoom.
Load session restores all of it. Session files are the right way to hand a fully set-up view to a colleague, or to come back to an analysis exactly as you left it.
Exporting the tree
| You want | Renderer | How |
|---|---|---|
| The edited tree as Newick | Either | Right-click → Export Newick / Export as Newick File (downloads tree.nwk). |
| A PNG image of the tree | Phylocanvas.gl | Right-click → Export as PNG Image. |
| The list of leaf labels | Phylocanvas.gl | Right-click → Export Leaf Labels. |
The SVG renderer has no built-in image export; to capture it as a picture, use your operating system’s screenshot tool. (PDF/SVG file export is not currently offered.)
13. Using Kronos inside Tableau
In Tableau, Kronos runs as a dashboard extension wired to one of your worksheets, so selecting a sample in the tree filters the rest of the dashboard, and selecting marks elsewhere highlights tips.
Add the extension
- In Tableau, drag an Extension object onto your dashboard.
- Point it at the Kronos
.trexmanifest. The canonical URL ishttps://kronos.theiagen.app/tableau/theia-phylo-extension.trex. (Version-pinned paths such as/tableau/v20251105/…exist for IT teams that need to freeze a version.) - If Tableau warns that the extension is untrusted, your Tableau Server admin must add
theiagen.appto the extension safelist (Server → Extensions). See Troubleshooting.
Tableau Desktop: Kronos defaults to the SVG renderer here, because Desktop’s embedded browser lacks WebGL. This is expected — the SVG renderer is fully featured. Tableau Server and Cloud run in a real browser and can use either renderer.
Configure the data source
On first load you get the Configuration dialog:
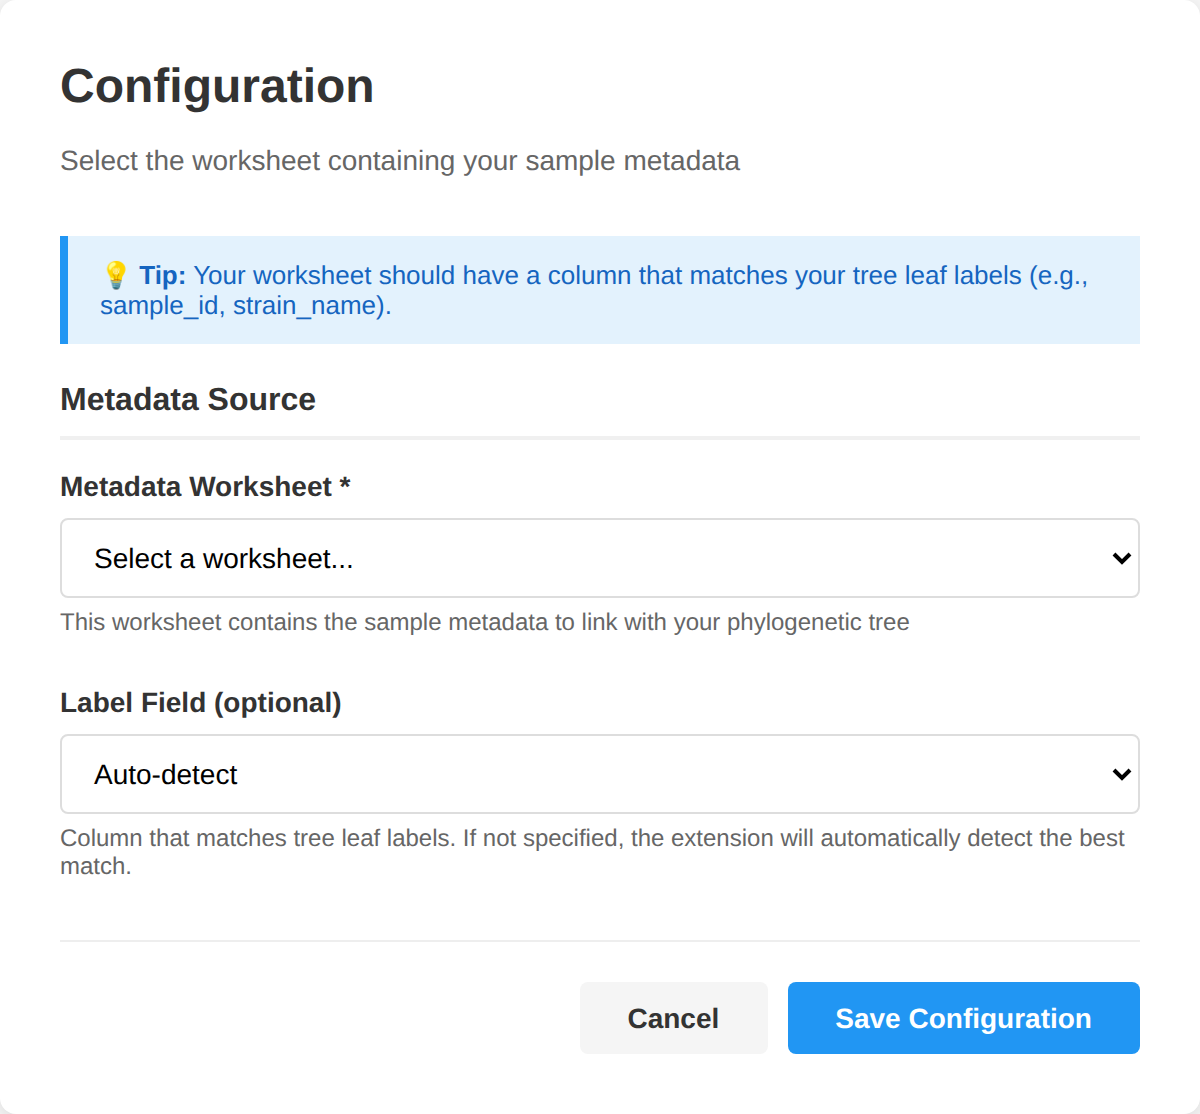
Figure 20. The Tableau Configuration dialog: choose the metadata worksheet, optionally set the label field (or leave it on Auto-detect), and save.
- Metadata Worksheet (required) — the worksheet holding your sample metadata.
- Label Field (optional) — the column that matches your tree’s leaf labels. Leave it on Auto-detect to let Kronos find the best match, or pick it explicitly.
- Click Save Configuration.
Then provide the tree itself (upload a Newick file, paste a link to one, or use the example), exactly as in Section 5. A tree you fetch from a link is saved to the dashboard just like an uploaded one.
The Tree Settings dialog
Open the extension’s settings to get a tabbed dialog. Note these ranges differ slightly from the standalone gear panel.
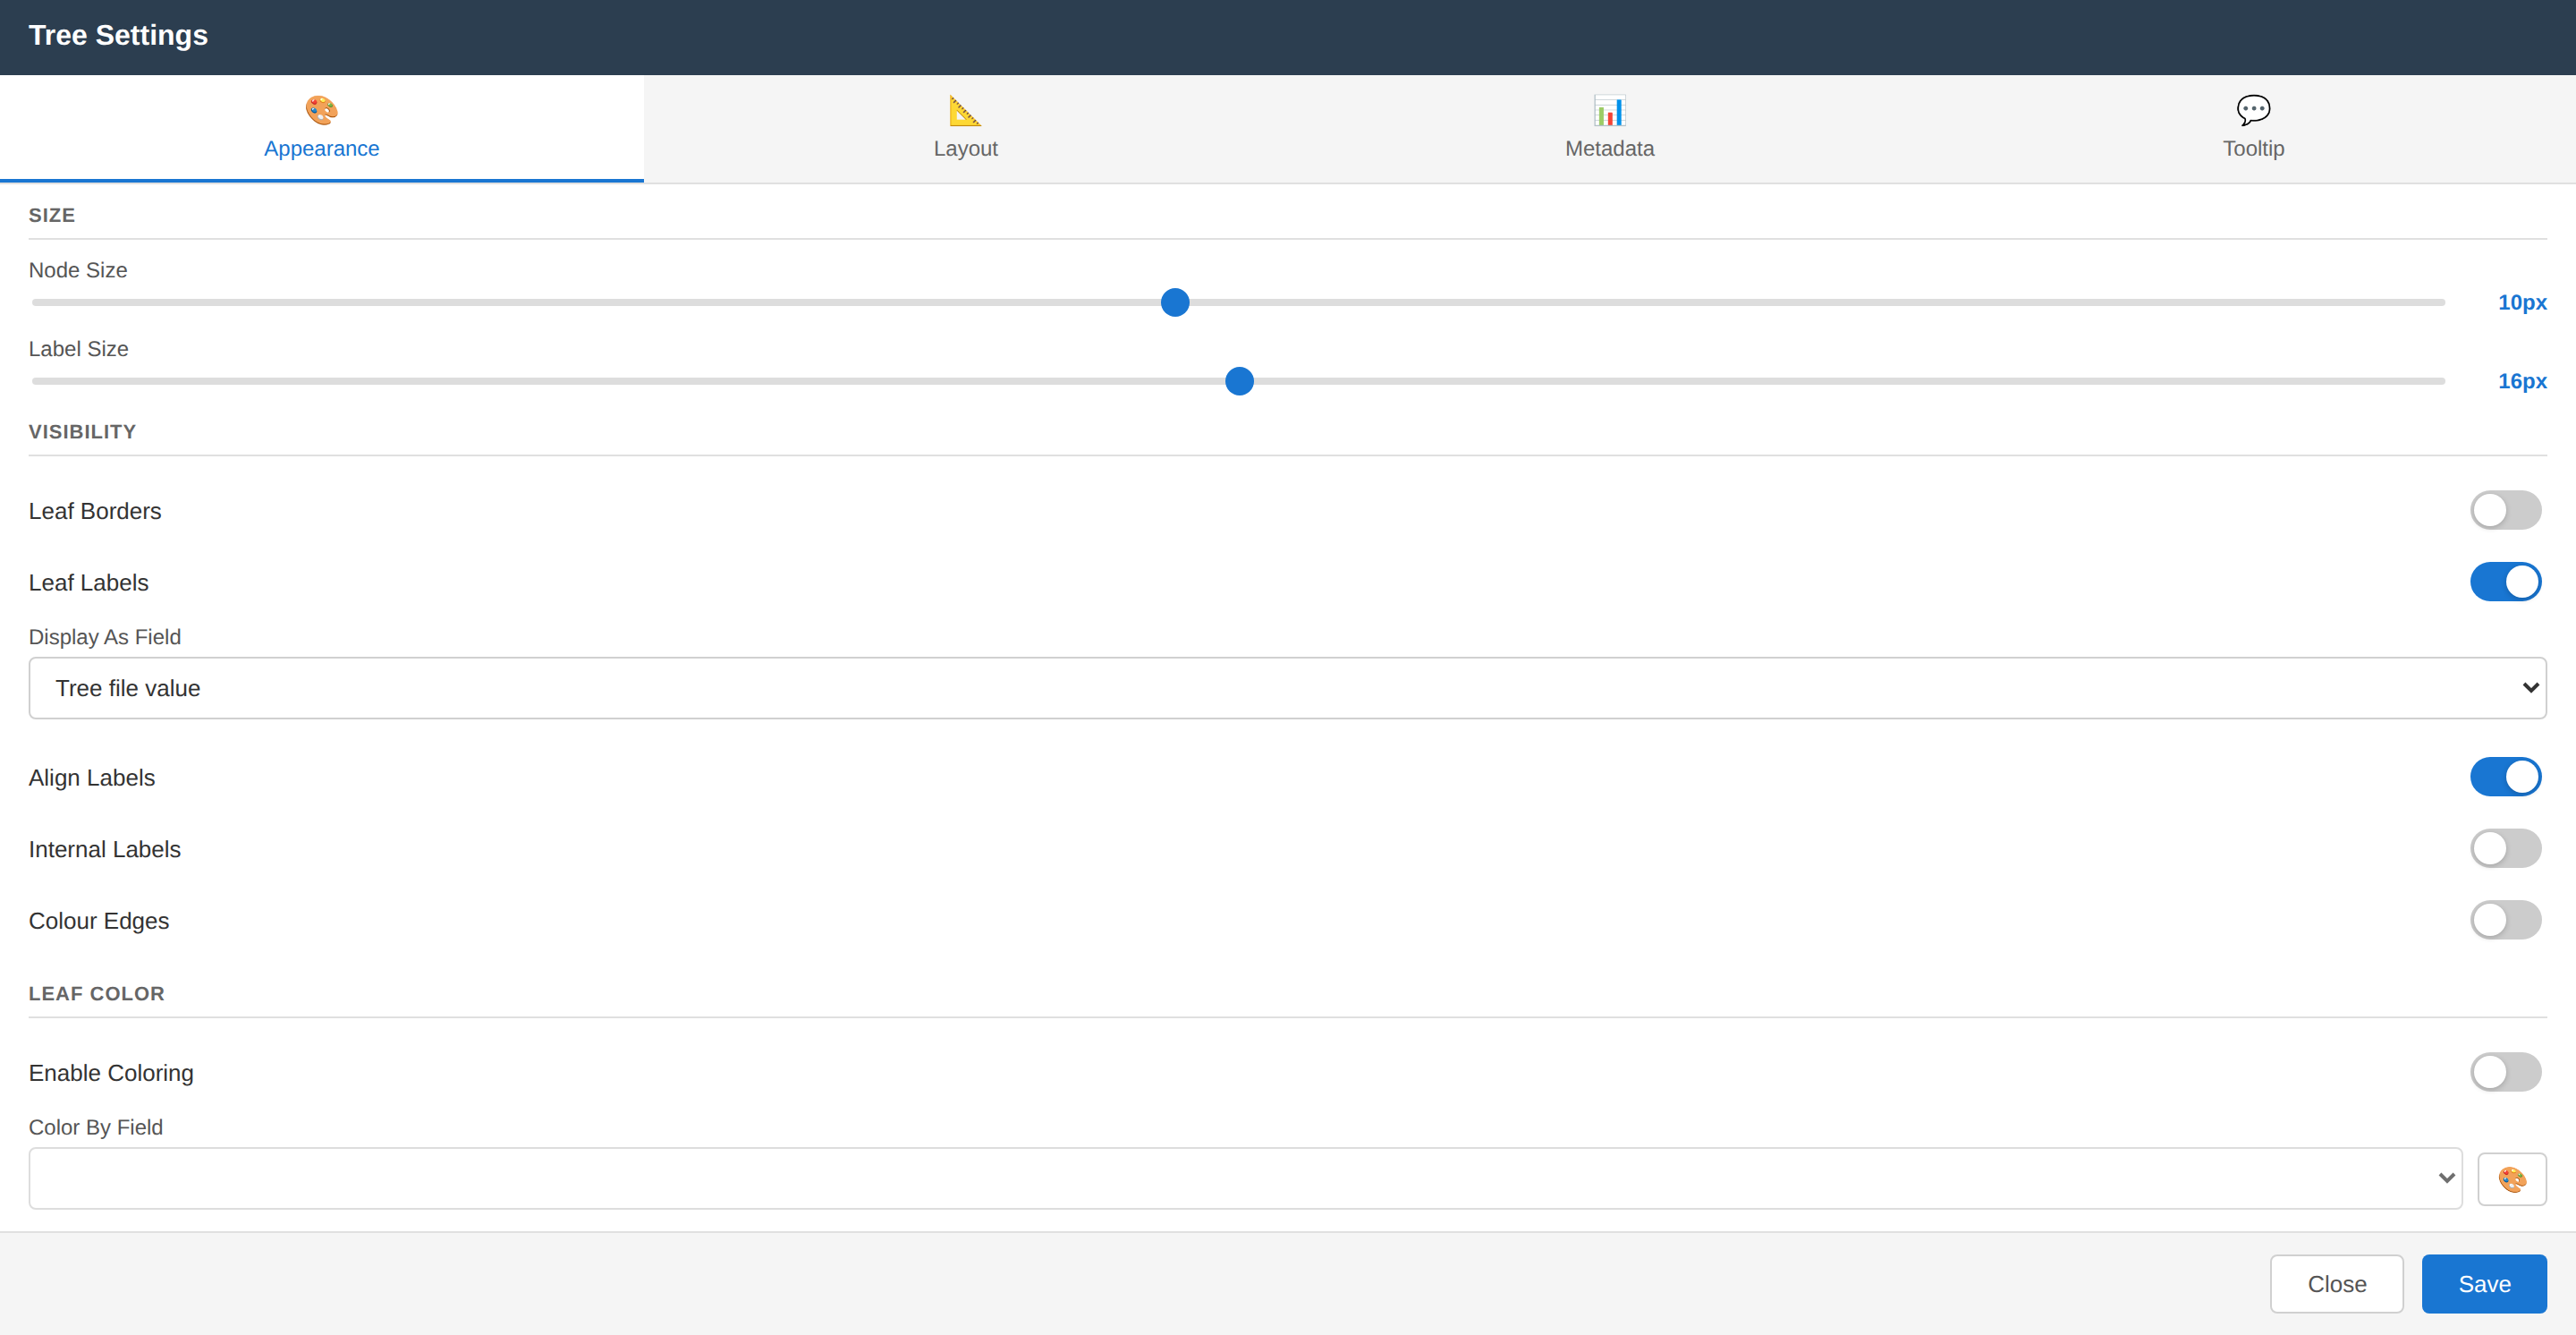
Figure 21. The tabbed Tree Settings dialog (Tableau). Each tab — Appearance, Layout, Metadata, Tooltip — groups related controls.
- 🎨 Appearance — Node Size (1–20), Label Size (8–24); toggles for Leaf Borders, Leaf Labels, Align Labels, Internal Labels, Colour Edges; a Display As Field dropdown (show a metadata column as the tip label instead of the tree’s own label); and Leaf Color (Enable Coloring + Color By Field + 🎨 palette).
- 📐 Layout — Layout Type (Rectangular/Radial/Circular/Diagonal/Hierarchical); Scale Bar (show, position, width); Branch Length with a Length Unit of None / Substitution Rate / SNP / Alleles (cgMLST/wgMLST), an Alignment Length (bp) box, Display Branch Lengths, and Decimal Digits; and Horizontal/Vertical Zoom.
- 📊 Metadata — choose which metadata fields appear as colour blocks (searchable, with select-all/deselect-all), a Legend (show, columns, position), and Block Size.
- 💬 Tooltip — enable hover tooltips and choose which fields they show.
Branch-length units. If your branch lengths are a substitution rate, set Length Unit and enter the Alignment Length (bp) — for example
29903for a SARS-CoV-2 genome — so Kronos can convert the rate into an interpretable SNP scale.
Selection sync
- Click a tip in the tree → the wired worksheet (and any dashboard filters built on it) filters to that sample.
- Select a mark/row in the linked worksheet → the matching tip is highlighted and centred.
Sync depends entirely on the label field matching leaf names exactly — see the golden rule.
Who can change settings (and why settings sometimes “reset”)
- A dashboard editor configures Kronos once and saves the workbook; those settings then travel with the workbook.
- A viewer sees the saved configuration read-only — by design, viewers cannot alter a dashboard’s saved state, so their changes are not persisted.
If settings appear to “reset,” the usual causes are: you are opening as a viewer, or the editor configured but did not save the workbook. See Troubleshooting.
14. Troubleshooting
| Symptom | Likely cause | What to do |
|---|---|---|
| Tree is blank (table shows, tree empty) | Phylocanvas.gl selected in an environment without WebGL (typically Tableau Desktop). | Switch Renderer to TheiaPhyloViewer (SVG) — it needs no WebGL. Or open the workbook in Tableau Server/Cloud. |
| Nothing colours, or selecting a row doesn’t highlight a tip | The label field doesn’t match leaf labels exactly. | Check the 🏷 label field is the right column; then compare one ID with one leaf label for whitespace, case, quotes, or _/./space differences. Fix the data or pick the correct column. |
| No leaves at all match the table | Wrong column chosen, or internal-node labels mistaken for tips. | Set the correct Label Field; confirm the IDs are tip labels, not internal-node names. |
| Settings reset after reopening (Tableau) | You opened as a viewer (read-only by design), or the editor didn’t save the workbook. | Have the editor configure once and save the workbook; viewers then see the saved view. |
Can’t add the .trex extension / Tableau says untrusted |
Wrong .trex, admin hasn’t safelisted theiagen.app, or a firewall blocks the host. |
Use the canonical .trex URL; ask your Tableau admin to safelist theiagen.app; ensure outbound HTTPS (443) to kronos.theiagen.app is allowed. |
| Selection sync broken (Tableau) | The extension is wired to a different worksheet than you’re selecting in, or a label mismatch, or a blank tree (WebGL). | Re-open Configuration and confirm the Metadata Worksheet; rule out the label-match and blank-tree cases above. |
| Newick file rejected on upload | File isn’t Newick (NEXUS/PhyloXML), has a BOM/Windows line endings/stray quotes, is truncated, or leaf names contain unescaped :/;/,. |
Validate the file in another phylogenetics tool. If it’s valid there but Kronos rejects it, capture the file and contact support. |
| Load Data button stays greyed out | No tree file selected (metadata alone isn’t enough). | Add at least one .nwk/.newick/.tree file. |
| “Fetch from URL” fails | The link points at an HTML page instead of a raw Newick file, the host blocks cross-origin (CORS) requests, the address is unreachable, or the request timed out. | Use a direct raw-file link (opening it in a browser should show plain Newick text, not a web page); pick a host that allows CORS (e.g. raw.githubusercontent.com); double-check the address and your connection. |
| Tree is very large / feels slow (SVG) | SVG draws every element. | Use Phylocanvas.gl (WebGL) for very large trees, or collapse big clades you aren’t studying. |
If a problem persists, gather: your environment (browser/OS; Tableau Desktop/Server/Cloud and version), the URL path you’re on, a screenshot, and — if you can — the browser console output (F12 → Console). That is exactly what support needs (Section 18).
15. Keyboard and mouse reference
| Input | Action |
|---|---|
| Drag on tree | Pan |
| Mouse wheel on tree | Zoom |
| Right-click tree | Context menu (Section 11) |
| Drag on tree (Lasso/Box mode, SVG) | Select the enclosed tips (Section 8) |
| Ctrl/Cmd-drag (Lasso/Box mode, SVG) | Add the enclosed tips to the selection |
| Click table row | Select row + centre/highlight its tip |
| Ctrl/Cmd-click rows | Multi-select |
| Click column header | Sort (▲ / ▼) |
| Shift-click / right-click column header | Set that column as the 🏷 label field |
| Esc | Clear the search; exit Lasso/Box mode (SVG) |
| F12 | Open browser console (for support/diagnostics) |
16. Privacy and data handling
In the standalone viewer, your tree and metadata are processed entirely in your browser. Files you load are never uploaded to any server — all parsing, rendering, colouring, and exporting happen locally. Closing or refreshing the page discards loaded data (your settings persist in the browser, but your data does not).
If you load a tree from a link, your browser fetches that one URL directly from the host you named — that request is the only thing that leaves your machine, and it goes to the host you chose, never to a Kronos or Theiagen server. Your own files are still never uploaded anywhere.
In the Tableau extension, your data lives in Tableau as usual; Kronos reads the configured worksheet through Tableau’s extension API to draw and sync the tree.
17. Glossary
| Term | Meaning |
|---|---|
| Phylogenetic tree | A branching diagram of inferred evolutionary relationships among samples. |
| Tip / leaf | An endpoint of the tree — one of your samples. |
| Leaf label | The name printed at a tip; what Kronos matches metadata against. |
| Internal node | A branch point representing a common ancestor of the tips beneath it. |
| Clade / subtree | An internal node together with everything descending from it. |
| Root | The base of the tree; the common ancestor of everything. |
| Branch length | The distance along a branch — substitutions, SNPs, alleles, or time, depending on how the tree was built. |
| Newick | The text format Kronos reads trees from ((A:0.1,B:0.2):0.0;). |
| Re-root | Move the tree’s root to a chosen branch; changes structure but preserves distances. |
| Midpoint root | Automatically root at the midpoint of the two most distant tips. |
| Ladderise | Reorder children by clade size so the tree reads as a tidy ladder. |
| Collapse | Fold a clade to a single marker without changing topology. |
| Halo | The coloured ring drawn around selected tips. |
| Scale bar | A reference bar showing how much branch length equals a given distance. |
| Metadata block | A coloured square beside a tip encoding one metadata field. |
| Label field | The metadata column matched to tree tips (marked 🏷). |
18. Getting help
- Built-in help: the Help (?) button in the standalone header is a quick reference.
- Hosted service:
https://kronos.theiagen.app/. - Support: email
support@theiagen.comwith your environment, the URL path you’re on, a screenshot, and browser console output if you have it — that lets the team reproduce and respond quickly.
Kronos is built by Theiagen Genomics for public-health and genomic-epidemiology work. The name and logo (a nod to Kronos, the Greek god of time — fitting for a tool about evolutionary history) were created by Inês Mendes.